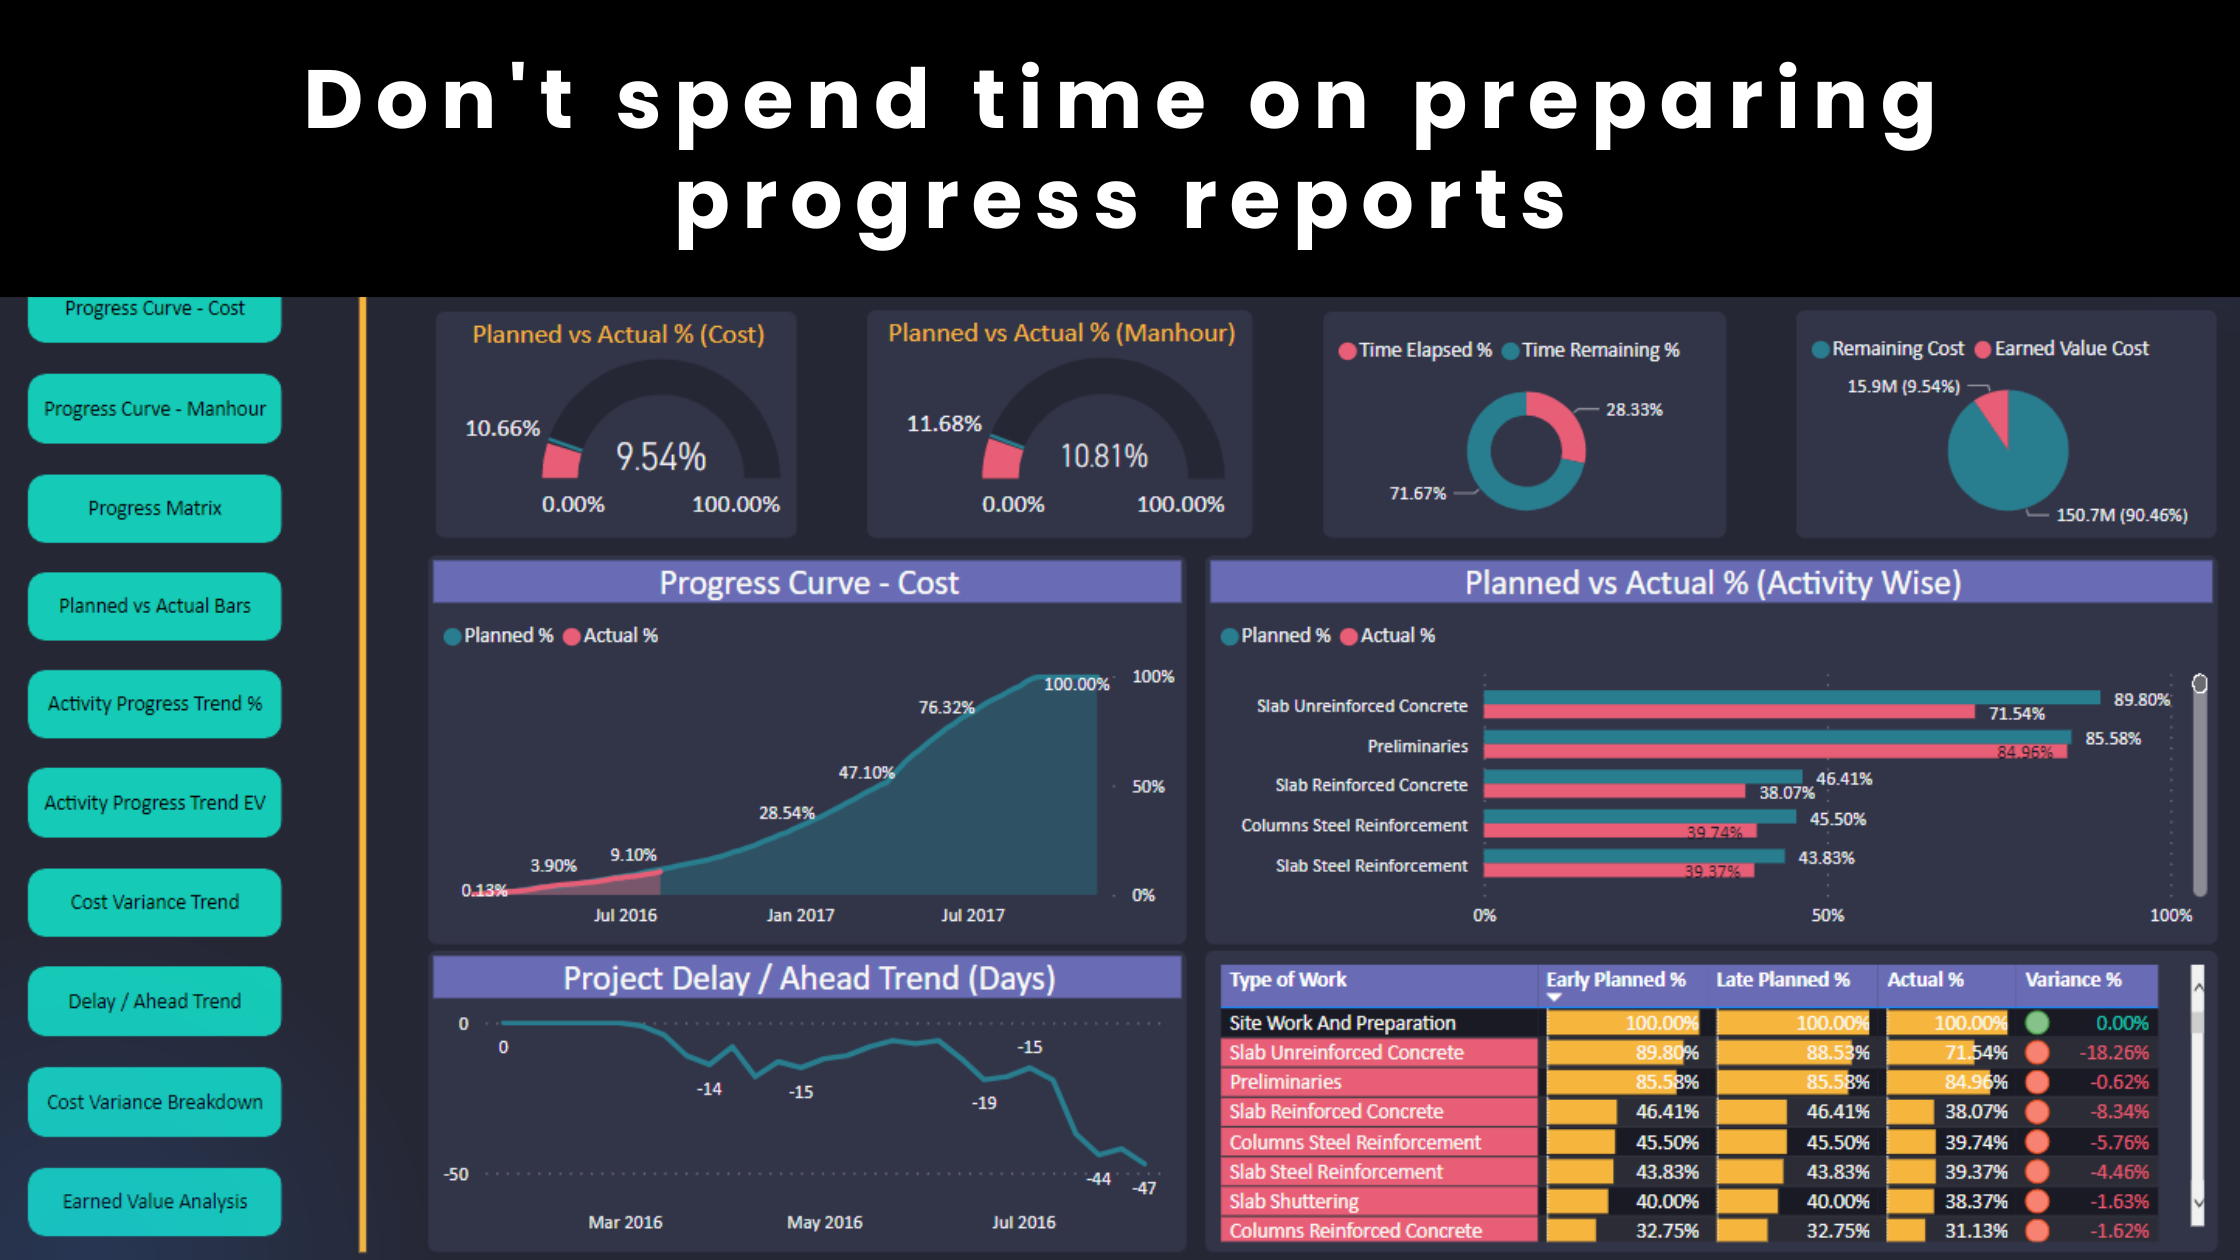
The determination of Early & Late Planned %, Actual % and Variance % is one of the key components in project control. Many planning engineers spend the time and effort to determine these percentages in every progress update cycle. They calculate and report these percentages for the overall project and the key project areas. However, variance analysis should not be static, it is a dynamic process that is often implemented based on your own needs. It is not uncommon to have thousands of activities in a schedule. Therefore, reporting variance indicators for the overall project and the key areas is meaningless unless it is accompanied by a more detailed analysis. At the same time, it is inconvenient to report the variance status for all activities. You need targeted analysis that is driven by causes and meaning because the human brain doesn’t know what it is looking for until it sees “triggers”.
For example, you prepare a report that shows an overall variance of -5%. As the project is in delay, you are motivated to investigate further. After some analysis, you found that concrete is the dominant cause of delay in the project. You analyzed further and determined that the formwork activities take longer than planned. However, you wouldn’t have looked at the formwork activities if you didn’t see a “trigger” in the concrete activities. Similarly, you decided to analyze the concrete performance when you saw a “trigger” related to the overall project delays. An interactive report or dashboard allows you to review the progress status and act on “triggers” with a click of a button and within seconds. Moreover, Power BI provides planning engineers with the below 8 pillars that are required to perform effective variance analysis.

1- Speed
How long does it take you to analyze the variance at different project levels?
2- Efficiency
How many intermediate steps do you need to follow to perform the variance analysis?
3- Reliability
How many connection points do you incorporate into your model? How easy is it to diagnose and resolve system issues? Working with 10 excel sheets and several XER files is not a reliable model. One Power BI file and one data connection source make a better model.
4- Convenience
Is the system easy to use? Do you need to be a tech person? Do you have to validate your formulas or calculations EVERY SINGLE TIME you analyze the variance?
5- Clarity
Are the data well organized? Can the reviewer analyze the outcomes without being confused?
6- Flow
Large projects have huge data. Does your model process data slowly? Do you have redundant data that affect your results?
7- Communication
What are your channels to communicate the results with your stakeholders? Are these channels user-friendly?
8- DFP (Done For Presentation)
How effective are you to extract data and quickly prepare a presentation for a meeting or any purpose? A presentation that is professional, beautiful, eye-catching and valuable and also keeps the reviewer engaged and impressed.

It is not really a science. The idea is to find a way to code the process. Your project control duties start with identifying where we are (a.k.a variance analysis). This is the basis of everything that happens afterward which may include recovery measures, progress curves, trend analysis, interactive reports, dashboards, breakdown analysis, risk analysis, etc. Therefore, effective variance analysis must have the above 8 pillars in order to add value to our projects. Unfortunately, many planning engineers follow the traditional analysis methods which include applying P6 filters and copying data into excel. This process will cause serious limitations in their workflows and will reduce their abilities to explore the variance in depth. On the contrary, Power BI provides great leverage to perform effective project control.
Regards,
Osama Saad, MBA, PMP, PSP, PMI-SP