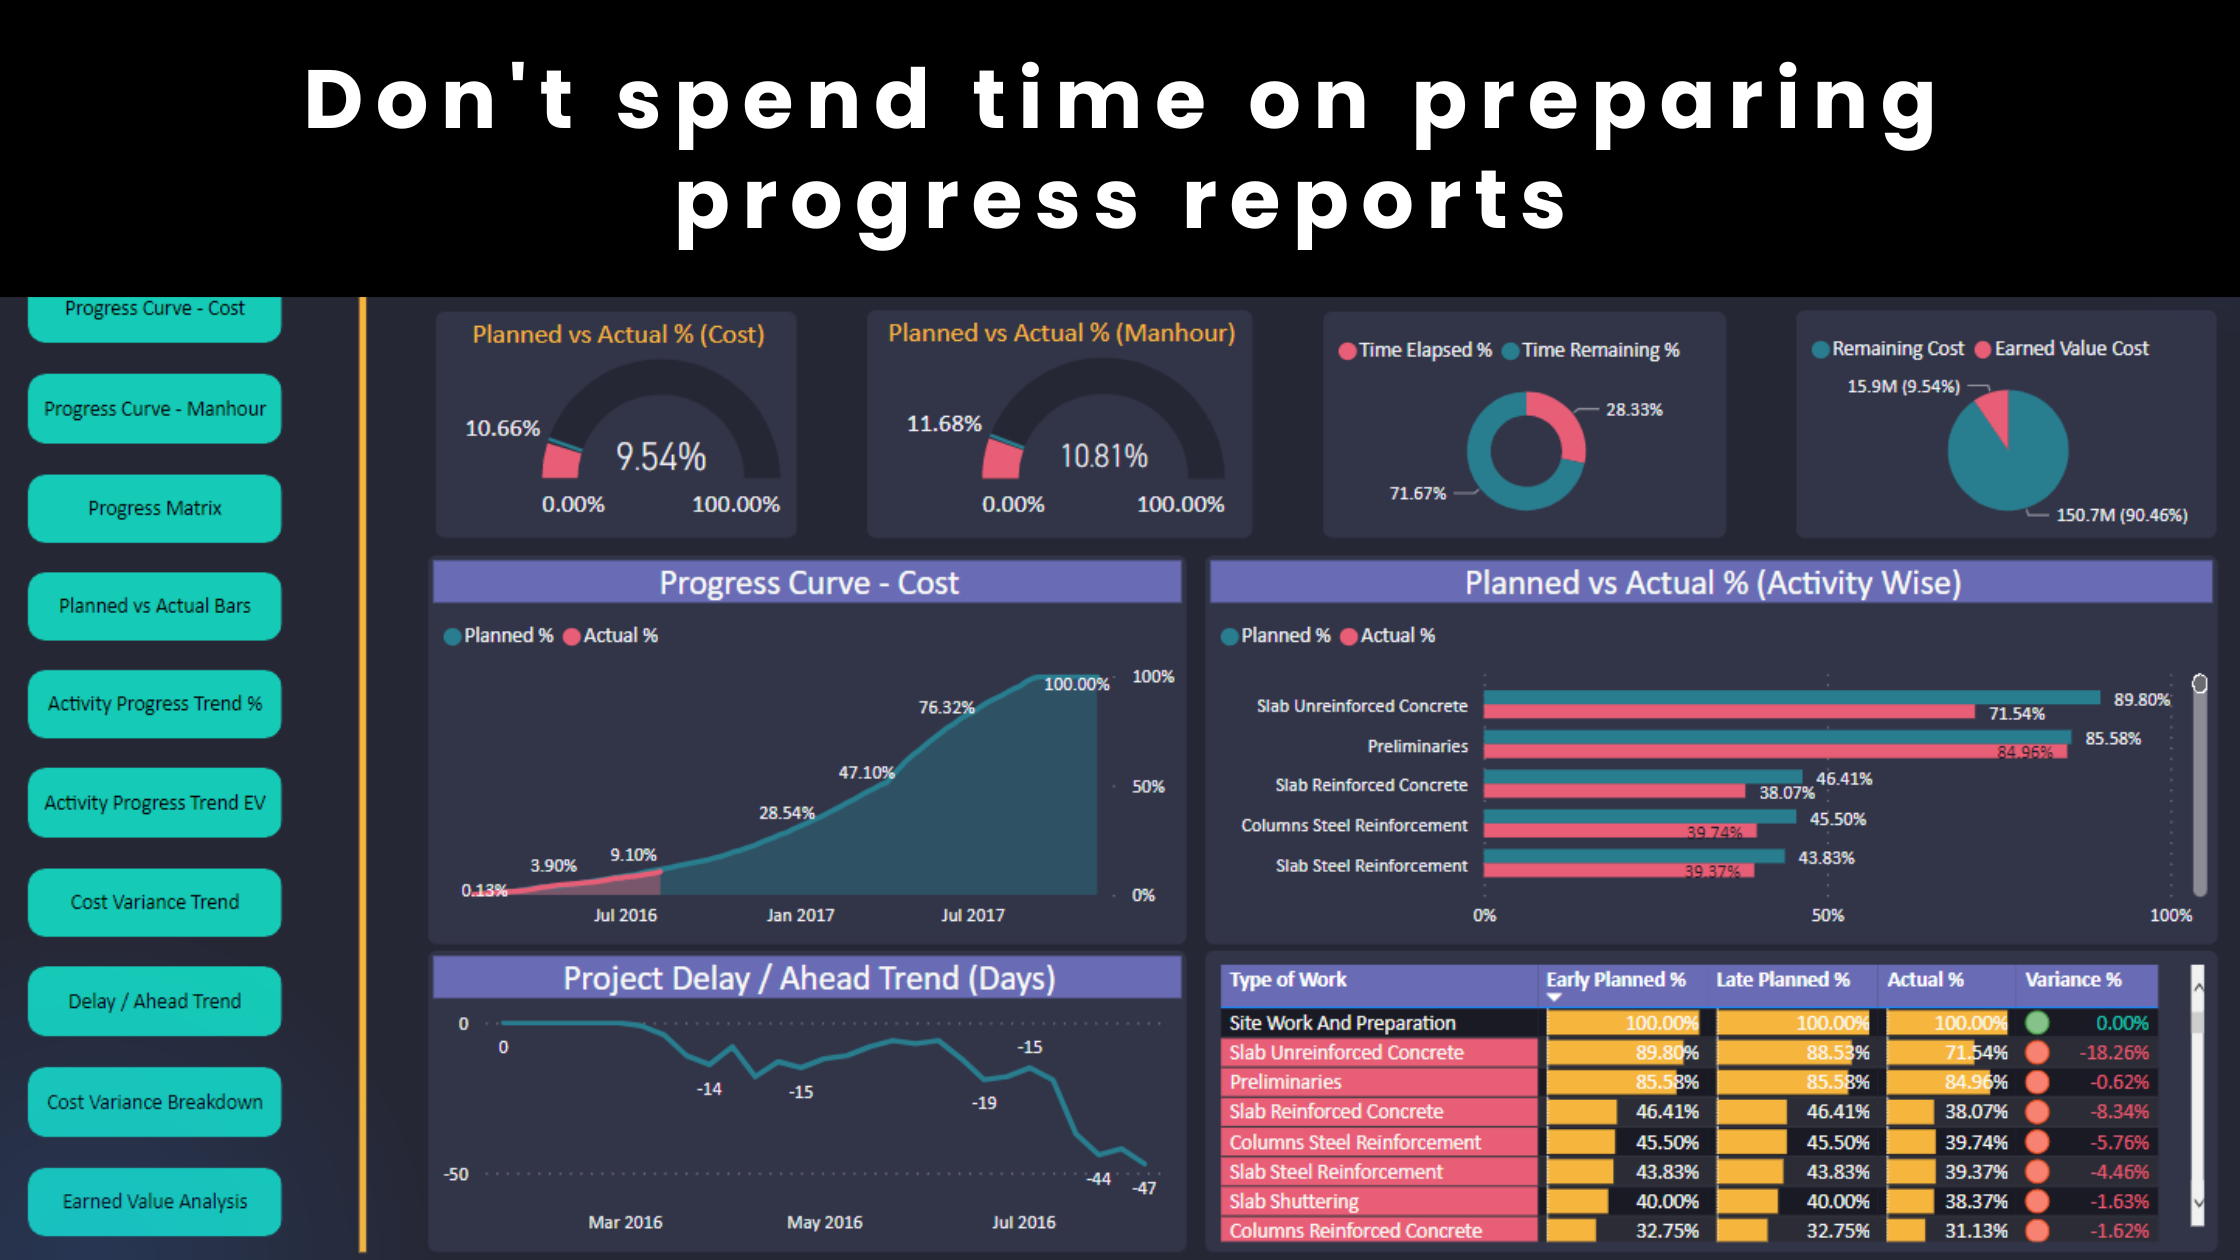
Planning Engineers are so busy looking at the variance and the associated metrics such as the difference between the planned and actual %’s or SPI. We are so obsessed with analyzing where we are and where we need to go. Nothing is wrong with that but it limits our ability to identify the root cause of delay and develop the necessary recovery measures. This article will demonstrate that analyzing the past is equally important in planning.
The problem
Imagine that an activity is 50% behind schedule. As a result, you calculate the required productivity and manpower to recover the delay. In the following week, you realized that the required progress hasn’t been achieved because it will take you at least 2 weeks to increase the manpower. You refine the recovery measures every week until the delay starts to decrease. The real problem is: how many valuable weeks can you afford to lose over the project life cycle before you recover the delay?
The solution
Planning engineers should look at the past performance of the activity. This will help them identify causes of delay easier and even prevent the delay in some cases. You can use Power BI to track the performance of any activity within seconds. In the below image, that’s how long it actually takes to view the historic performance; it literally takes 5 seconds (I don’t know about you but this is phenomenal). It is amazing to see how technology can do that for us. Now, let’s look at a real-life example. In the below image, the activity is ahead of schedule but here is an interesting fact. The activity took 5 weeks to complete, while it should have taken only 3 weeks as per the baseline schedule. Therefore, if we continue with the same progress, the time savings will be depleted and the activity will eventually fall behind schedule. Planning Engineers are expected to perform this type of analysis and highlight key issues to the decision-makers. For another activity, you might realize that there was no progress over the past week. Typical variance analysis isn’t really effective to observe similar progress issues. Analyzing past performance in an interactive way is essential to deal with the delay before it occurs or even escalates.

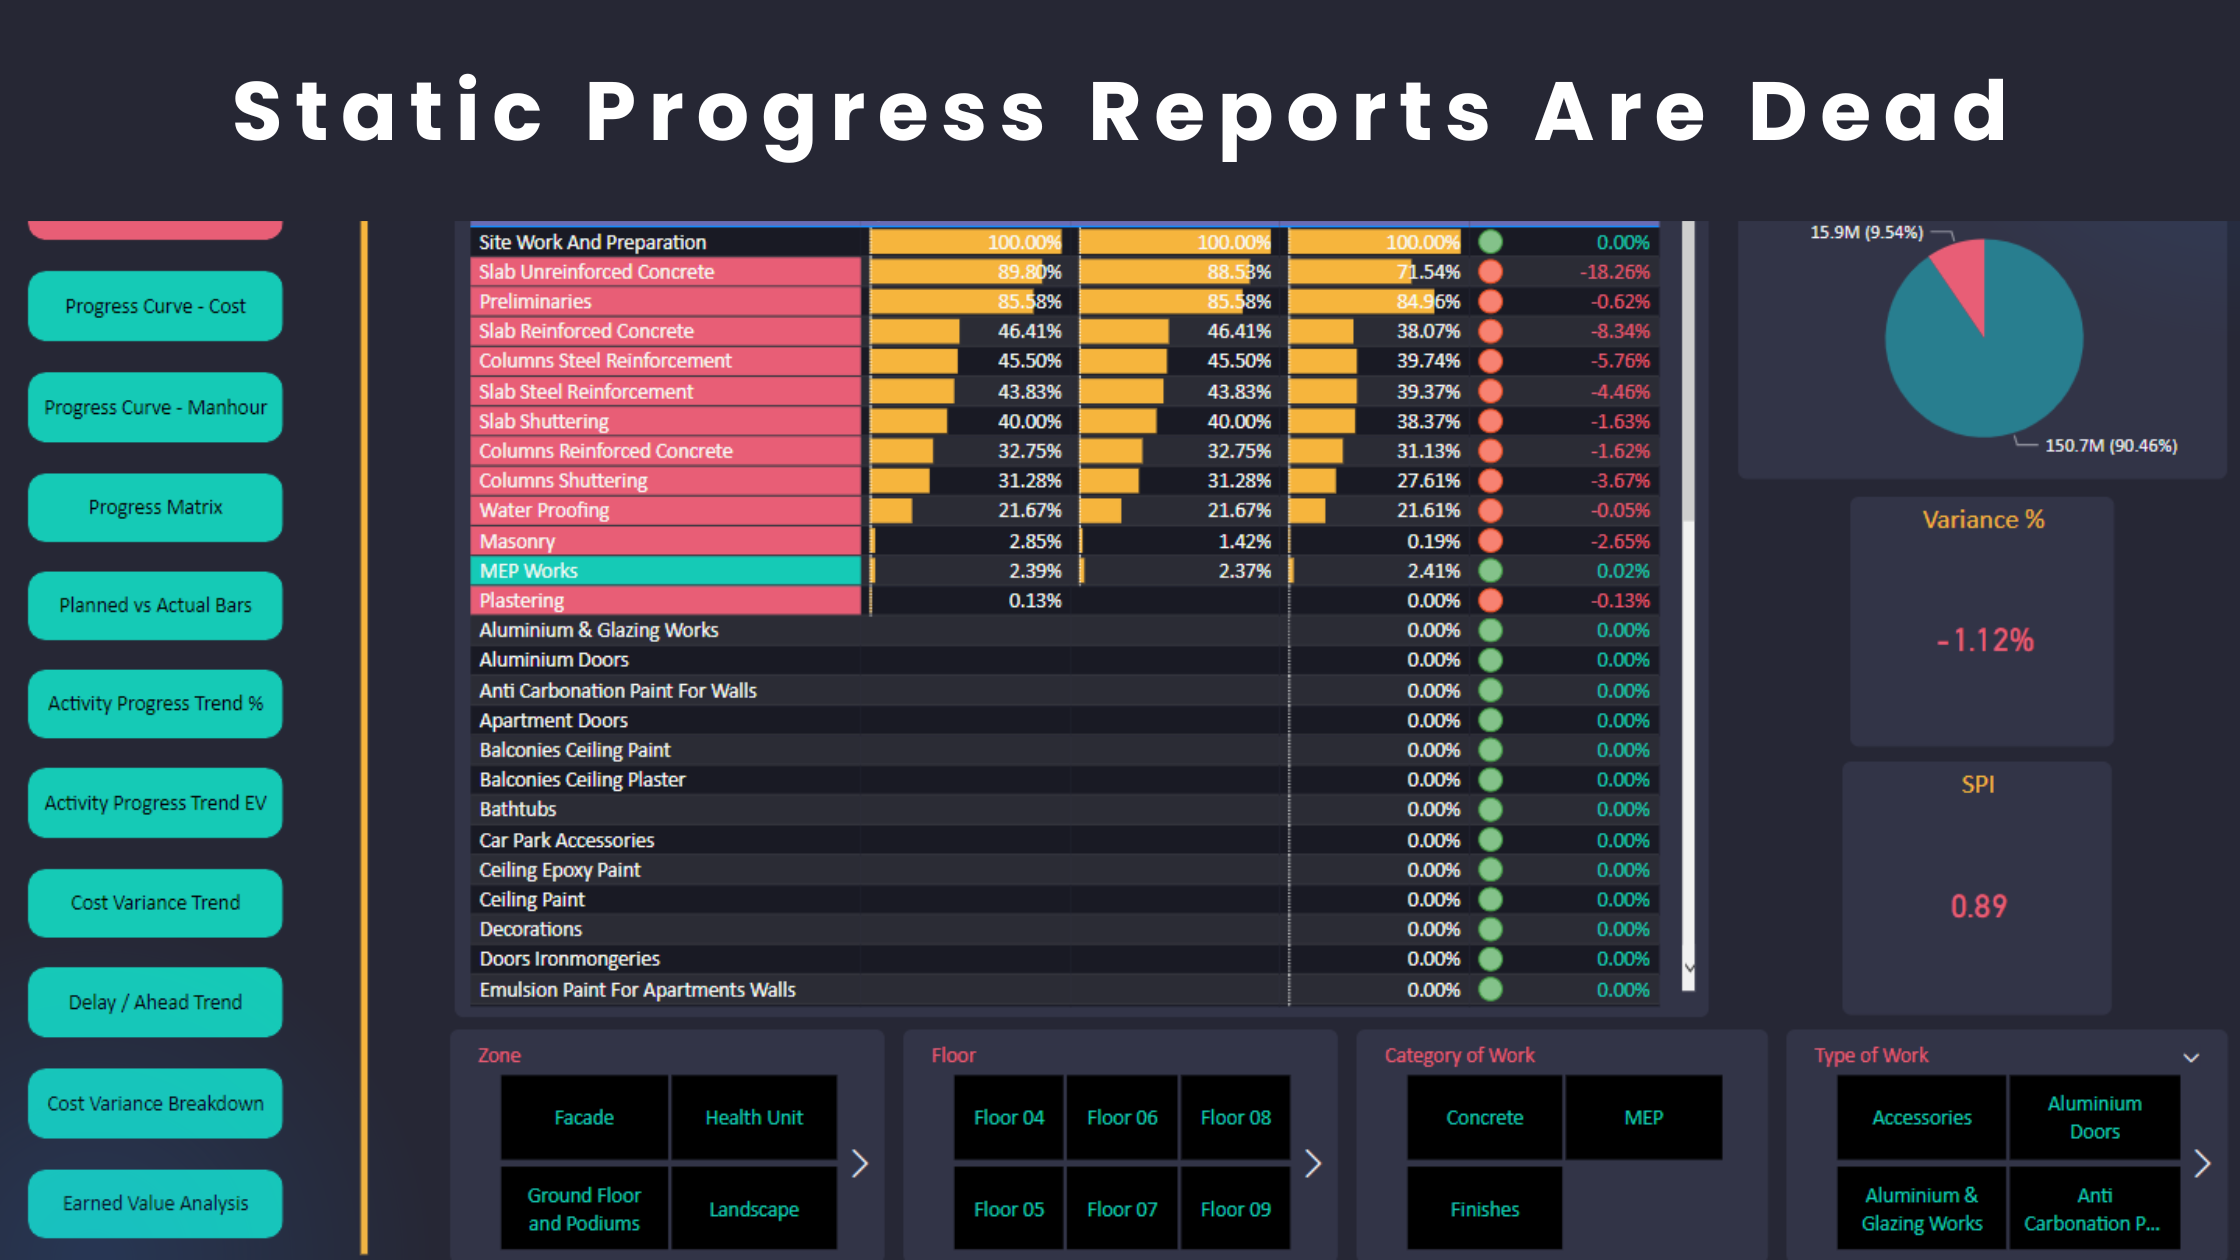
Other benefits
The benefits are not limited to dealing with project delays. In the performance analysis as shown in the below image, you can see additional valuable metrics to analyze your progress, including but not limited to:
✅ Activity % complete for this week period only.
✅ Cumulative activity % complete achieved over time.
✅ Cumulative planned % for the activity over time.
✅ Which week has the activity actually started and finished?
✅ Which week the activity was supposed to start and finish as per the Baseline Schedule?
✅ Add any parameters to assist you with your analysis for this specific activity (e.g. Earned Value, Budgeted Total Cost, Budgeted Labor Units, etc). You can view them when you hover over any column.

How many planning engineers do you know who can perform similar valuable analysis that helps projects move forward? The job market needs such practical skills; not a master’s degree. Can you imagine how stakeholders and top management can recognize your skills when you analyze progress and answer questions within seconds in a meeting using Power BI? That’s how planning engineers add value to the marketplace and stand out from the competition. Leverage is king!
Regards,
Osama Saad, MBA, PMP, PSP, PMI-SP
Learn More!