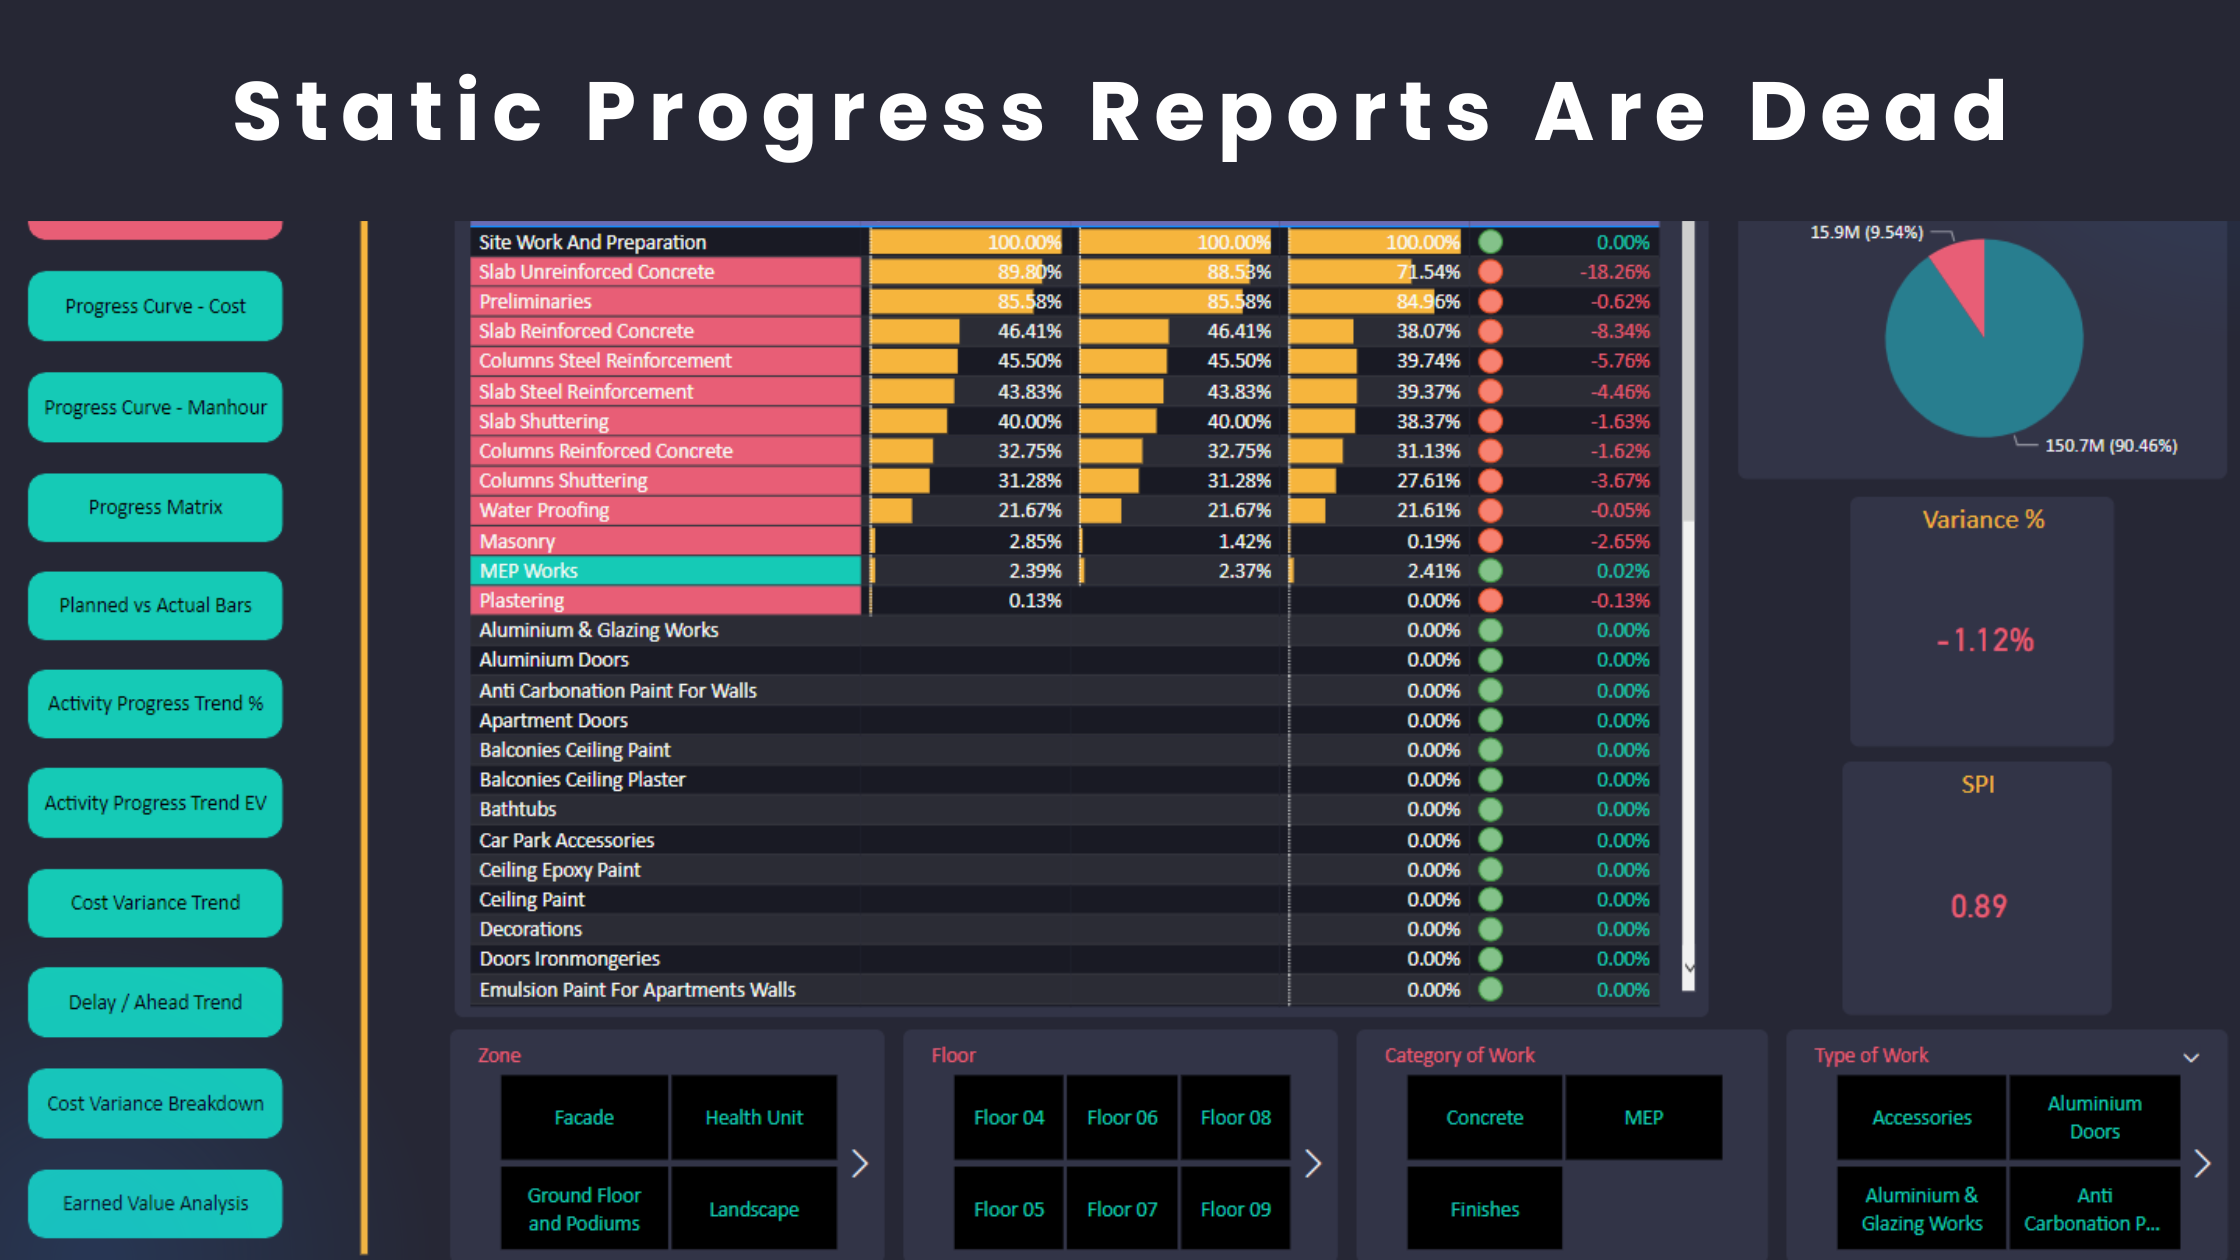
Planning Engineers are overwhelmed with so many tools and files. They use different tools such as Primavera P6 for progress review, excel for progress analysis and PowerPoint for progress presentation. Moreover, they use many excel sheets for different purposes which may include: Variance Analysis, Breakdown Analysis, Trends, Dashboards, Progress Curves, a Progress Matrix, Gantt Charts, etc. You can apply intermediate formulas among different files but each file has its own configuration setup.
Here is what the main workflow for most planning engineers looks like.
- Assign the Baseline Schedule to the Schedule Update in P6.
- Apply filters as necessary to perform the analysis.
- Copy data into multiple Excel sheets where formulas are established.
- Compile all outputs into a single report.
- Prepare presentations using PowerPoint.
The Problem
Here are some of the problems associated with working with multiple files:
- You might run the risk of referring to the wrong XER file while you work.
- You forgot to update some excel formulas when you prepare the report.
- You may have typing errors.
- You will most likely deal with excel formulas errors.
- It is hard to set up validation points to identify the root cause of the problem in your configurations.
- You will waste a lot of time following this process.
Moreover, this workflow has many problems beyond the progress report preparation. The report review doesn’t get any easier. You will probably need to import multiple XER files as necessary or navigate among different files in the report to look for the information that you need.
Working with many files causes huge friction, constraints, limitations, congestion and tasks traffic. Dealing with many planning files may help you arrive at the desired destination but you never reach your full potential. Moreover, you will also feel exhausted and unable to deliver “value”. In addition, this process often produces static reporting, not interactive.
The solution
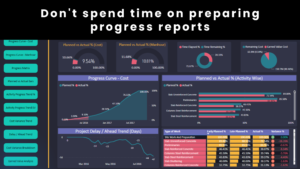
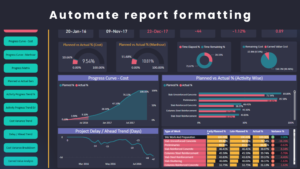
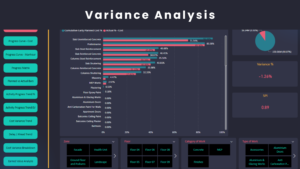
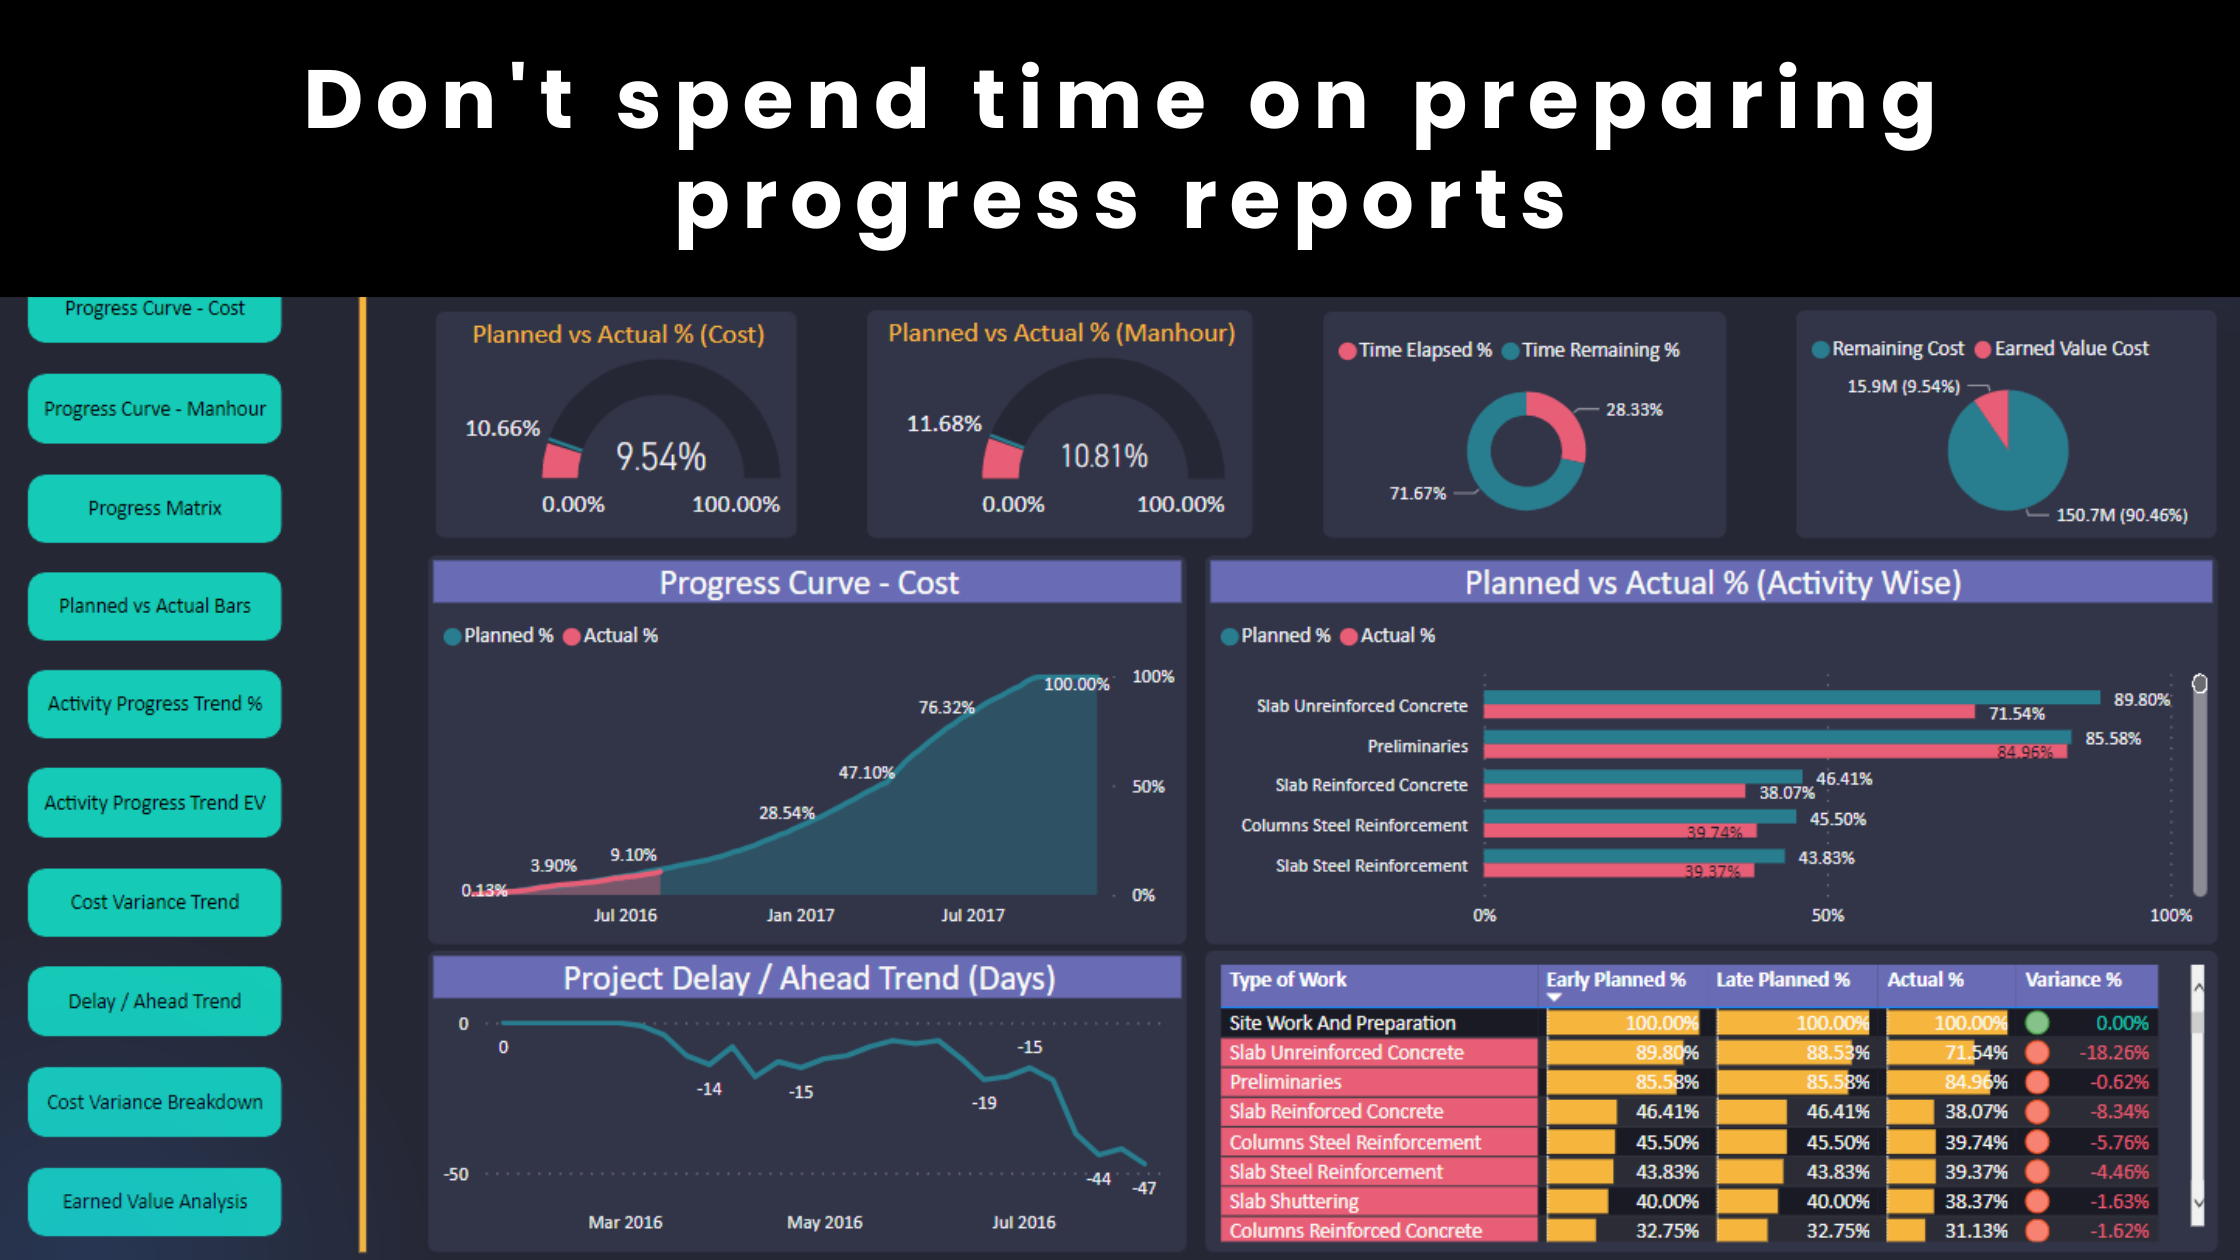
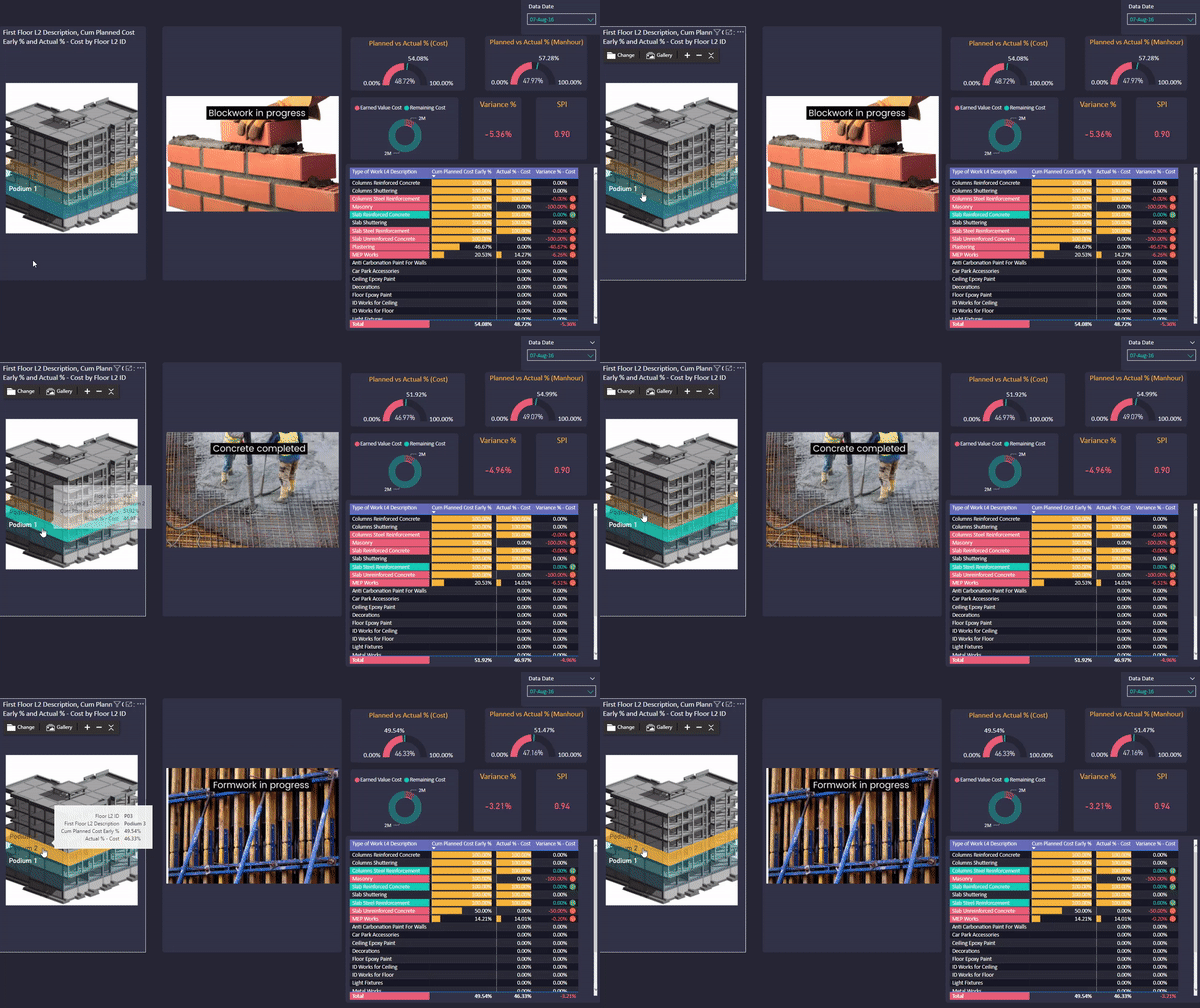
You should have all your project control work in one file under one layout using one tool only. This helps you connect all project control data easily and build interactive reports effectively. Here is what it looks like inside Power BI.
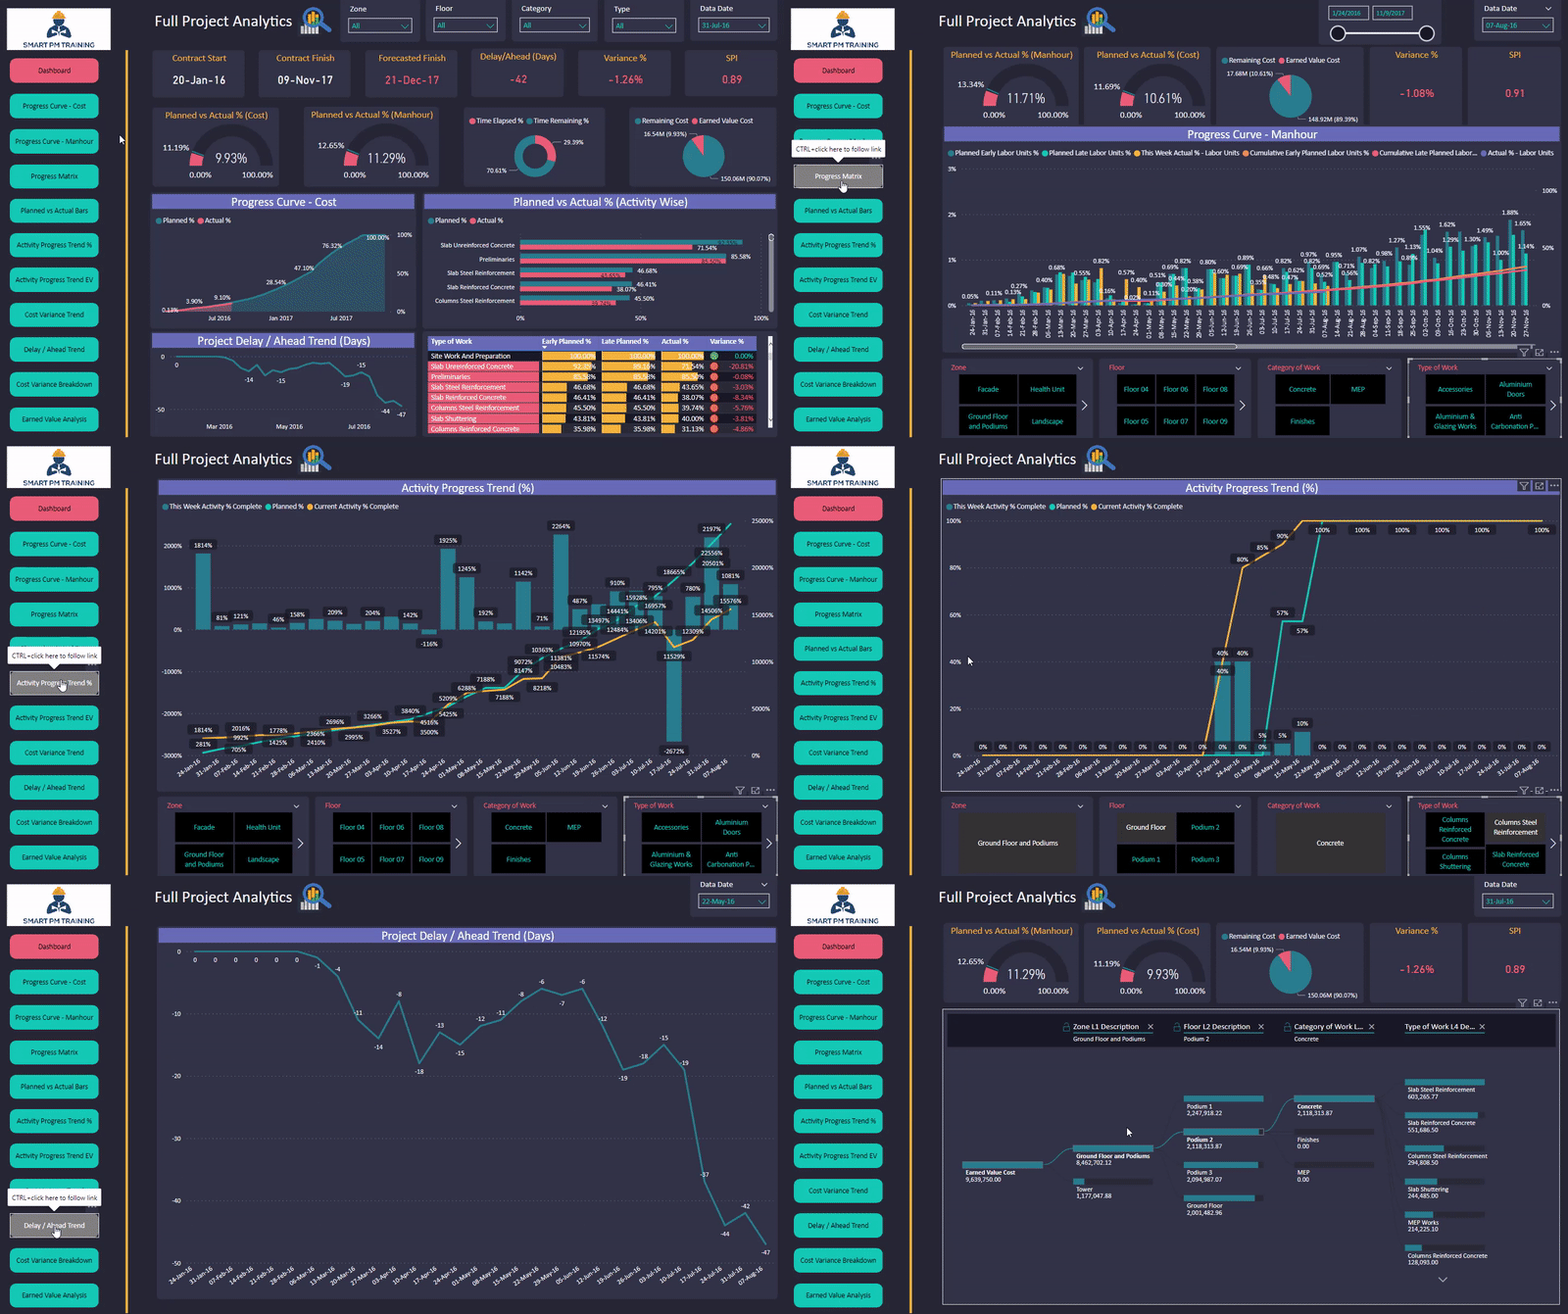
Your project control model should operate like a subway where you:
- Avoid friction and the constant task “traffic”.
- Utilize systems to reach your full potential and add value.
- Perform your tasks using shortcuts.
- Maximize efficiency and improve the task flow in your operations.
- Create presentations with a click of a button without the need to spend time using PowerPoint.
You simply have full control when you have everything available and connected in one place. While you still need scheduling software such as P6, you will definitely need a powerful data analytics processor to have everything under ONE.
63c4241e232a2_lg.png)
Power BI provides planning engineers with great tools that help them complete most of the project control tasks on autopilot and in a seamless way. That’s the power of ONE in project control.
Regards,
Osama Saad, MBA, PMP, PSP, PMI-SP
Learn More!

