The Trojan Horse of Project Control
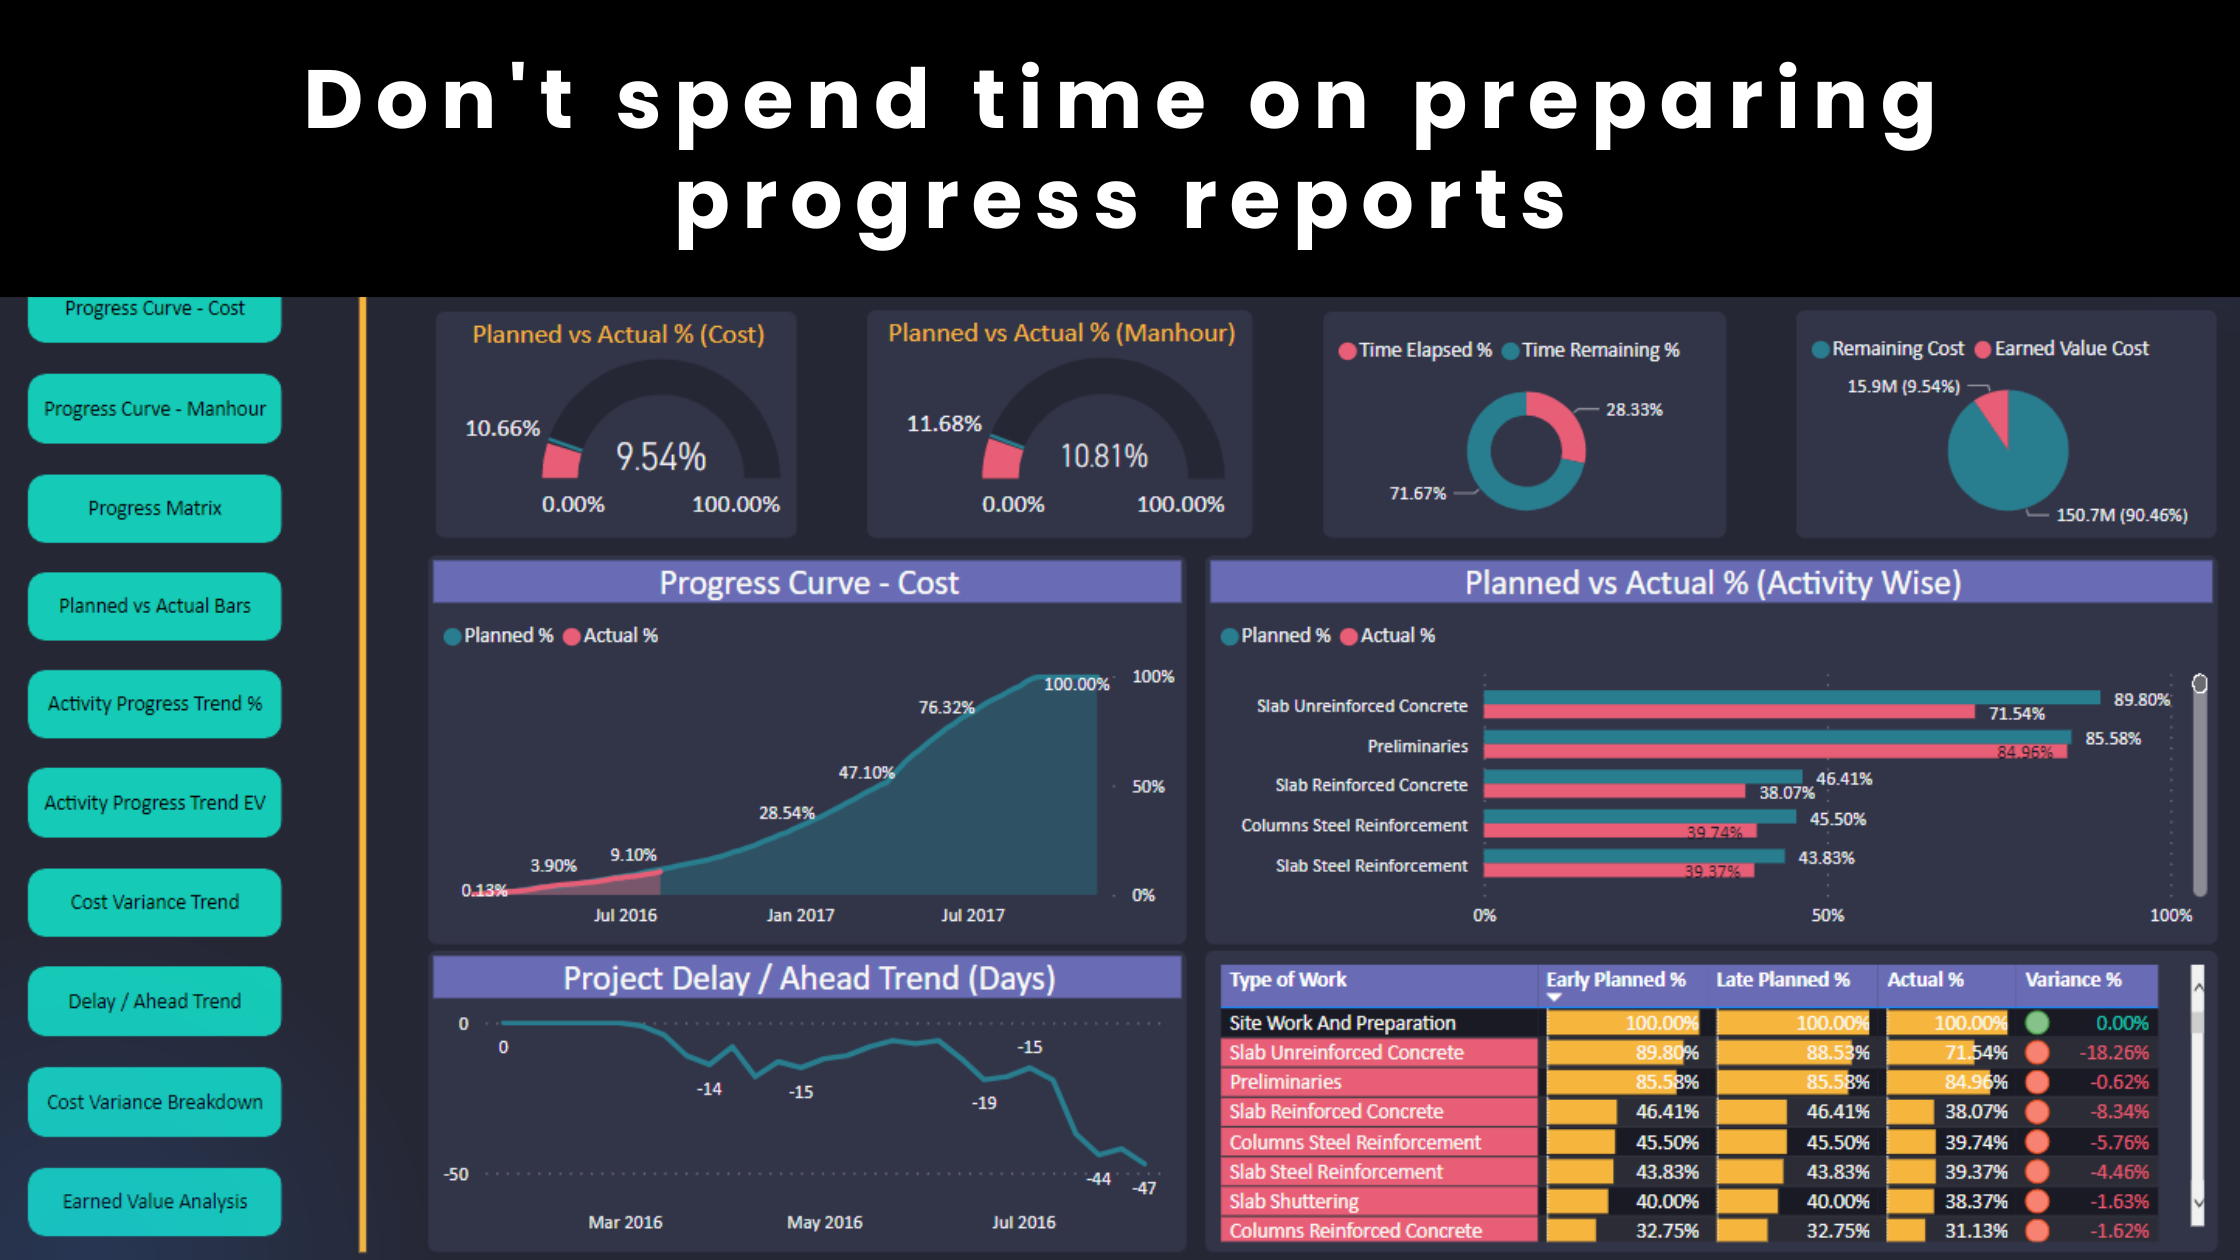
In project control, reports and dashboards play a critical role in decision-making. A well-structured, visually appealing report can make complex project data look simple and intuitive. But here’s the danger: your eye catching dashboard could be a Trojan horse that compromises your project’s success.
Human decision-making is inherently biased, and we often don’t realize how these biases influence our judgment.

The Illusion of Accuracy
When key decision-makers see a well-designed dashboard, they naturally assume that:
✔ It was prepared by a qualified planner who knows what they are doing
✔ The results must be accurate because the presentation is professional
✔ The numbers and insights can be trusted without further scrutiny
This is a cognitive bias known as the aesthetic-usability effect, where people perceive well-designed things as more accurate, reliable, and useful—even when they’re not.
But in project controls, data visualization is just the surface. The real story lies beneath—the calculation models, quality of inputs, assumptions, and methodologies used to generate the numbers.
Question the Report, Not Just the Design
🔹 A report is only as good as the data behind it.
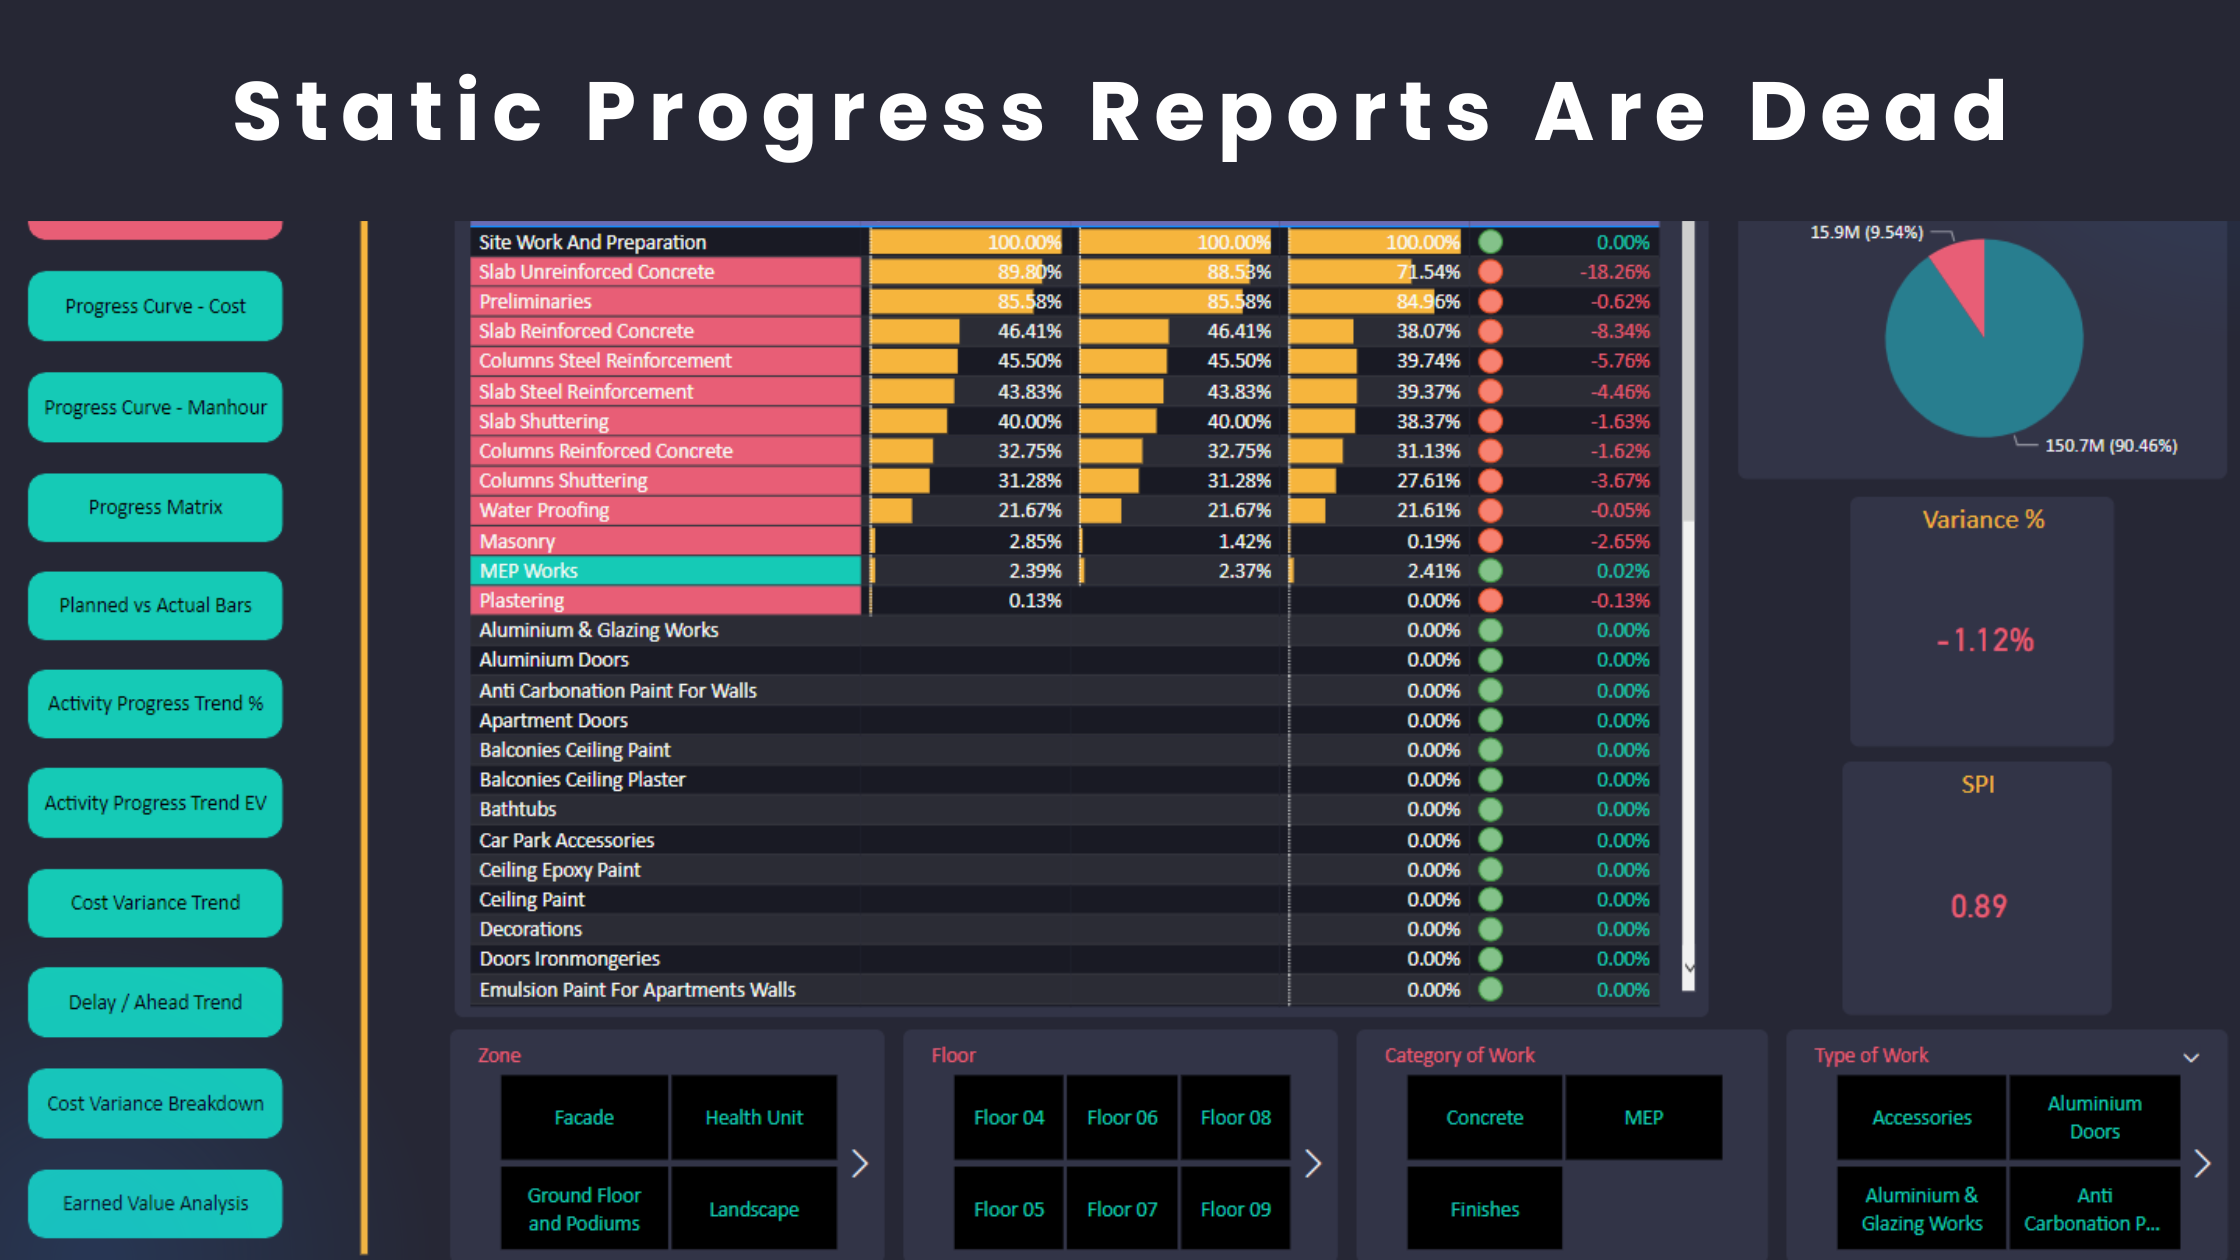
🔹 Dashboards don’t tell the full story—they summarize it only.
🔹 Attractive visuals do not equal accuracy.
Project controls are not about making beautiful reports; they are about making correct and actionable decisions based on solid analysis.
Before relying on a dashboard, we must ask:
✅ How were these numbers calculated?
✅ What assumptions and constraints were used?
✅ Are the forecasts and trends based on reliable data?
If the calculations behind the report are flawed, then even the most well-designed dashboard is dangerous—it will mislead stakeholders into making poor decisions with confidence. It is a responsibility of the technical reviewer (e.g. the consultant’s planner) to validate the configurations of the report.
Engineers vs. Designers
A planner or project controller’s job is not just to present data attractively — it is to analyze, validate, and ensure accuracy.
➡ If you just need an attractive dashboard, hire a graphic designer — not an engineer.
➡ If you need accurate project insights, hire a qualified project controller who understands the methodology behind the numbers.
Final Thoughts
🚨 A misleading report is worse than no report at all. 🚨
In project controls, decisions should be based on validated analysis, not visual appeal. A well-designed dashboard might look impressive, but always question the data behind it before making critical decisions. We must ensure our reports reflect reality, not just aesthetics.
Regards,
Osama Saad, MBA, PMP, PSP, CCP, PMI-SP
Learn More!