Formatting is one of the most time-consuming low-impact activities for planning engineers. Although formatting is necessary, it is not considered a key value activity compared to delay analysis, schedule update, etc. In other words, if you have limited time during the day, you would better spend that time on high-impact activities such as claim submission, progress analysis, highlighting delays to the site team, attending meetings and so on. On the other hand, formatting doesn’t have the same high impact on the project control deliverables. Although formatting is an essential element of high-quality reports and presentations, it takes a lot of the scheduler’s valuable time.
I believe that formatting should be the first task that should be automated in your workflow. However, many planning engineers don’t really know how this can be done in a practical way. You might have tried to prepare excel templates that can be updated on weekly basis. However, here are some of the challenges that you typically face when you format your reports inside excel.
- You still need to do formatting for any new reports or dashboards.
- It is challenging to ensure the same colour selection and formatting consistency across the whole report.
- You might need to prepare quick ad-hoc reports for your own analysis where formatting will be required to make the findings clearly and easily readable.
- You might need to report certain data that are requested by stakeholders. High-quality formatting for the final product will still be needed.
- You will be using “format painter” a lot inside excel.
- You will format fonts and tables most of the time too.
Each of the above takes time. When you add up this time, you realize that you wasted many hours that could have otherwise been spent on performing effective analysis that helps the project move forward.
You can incorporate tools such as Power BI in your workflow to automate formatting. Here is what you can do inside Power BI.
1- Create Themes
When you develop your design inside Power BI, you can define your preferences which may include some of the following:
- Font Size and type for chart data, title, labels, etc
- Font colours for chart data, title, labels, etc
- Chart colours and background colours
Not only will this save you a lot of time in formatting new charts but will also ensure consistency across the whole report or presentation because pre-defined characteristics will be automatically applied to each element in the same report. Such characteristics include, for example, the exact colour grade and font colour.
2- Bulk formatting
Unlike excel where you have to format each cell, Power BI allows you to format a whole report, page or chart within seconds. Select the elements that you wish to format and customize the associated font, colours, charts labels and data. All changes will be immediately applied to your selections.
3- Professional looks
Power BI is designed to analyze data and report findings. Therefore, a Power BI report will look way more professional and beautiful than excel. Although you can have great formatting inside excel, you will need extremely good software skills to prepare beautiful dashboards. On the other hand, it is a lot easier to produce the same quality or even much higher using Power BI.
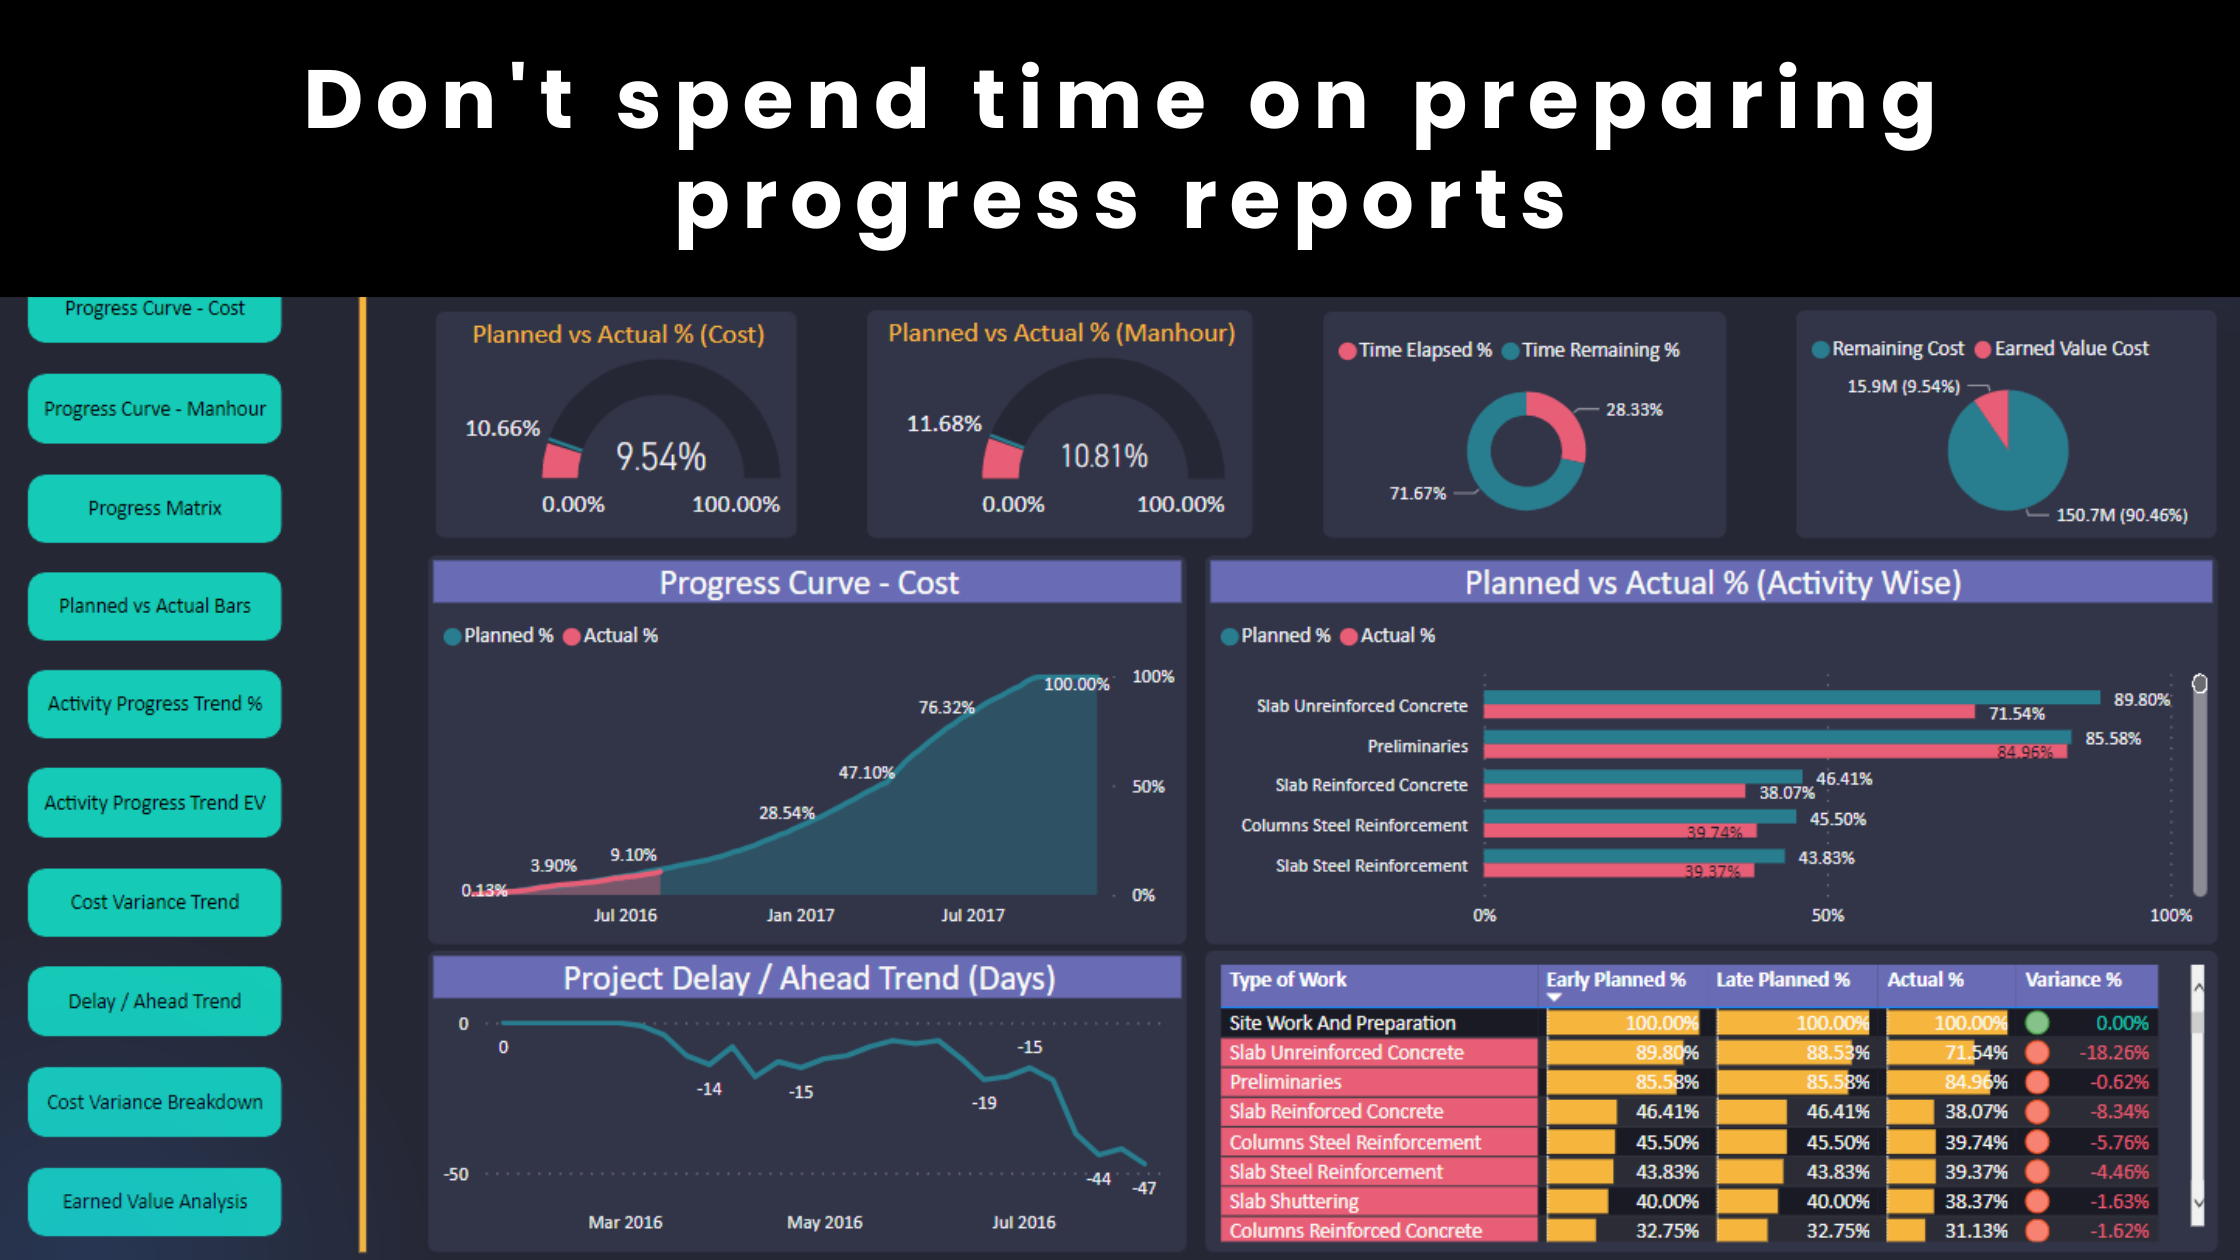
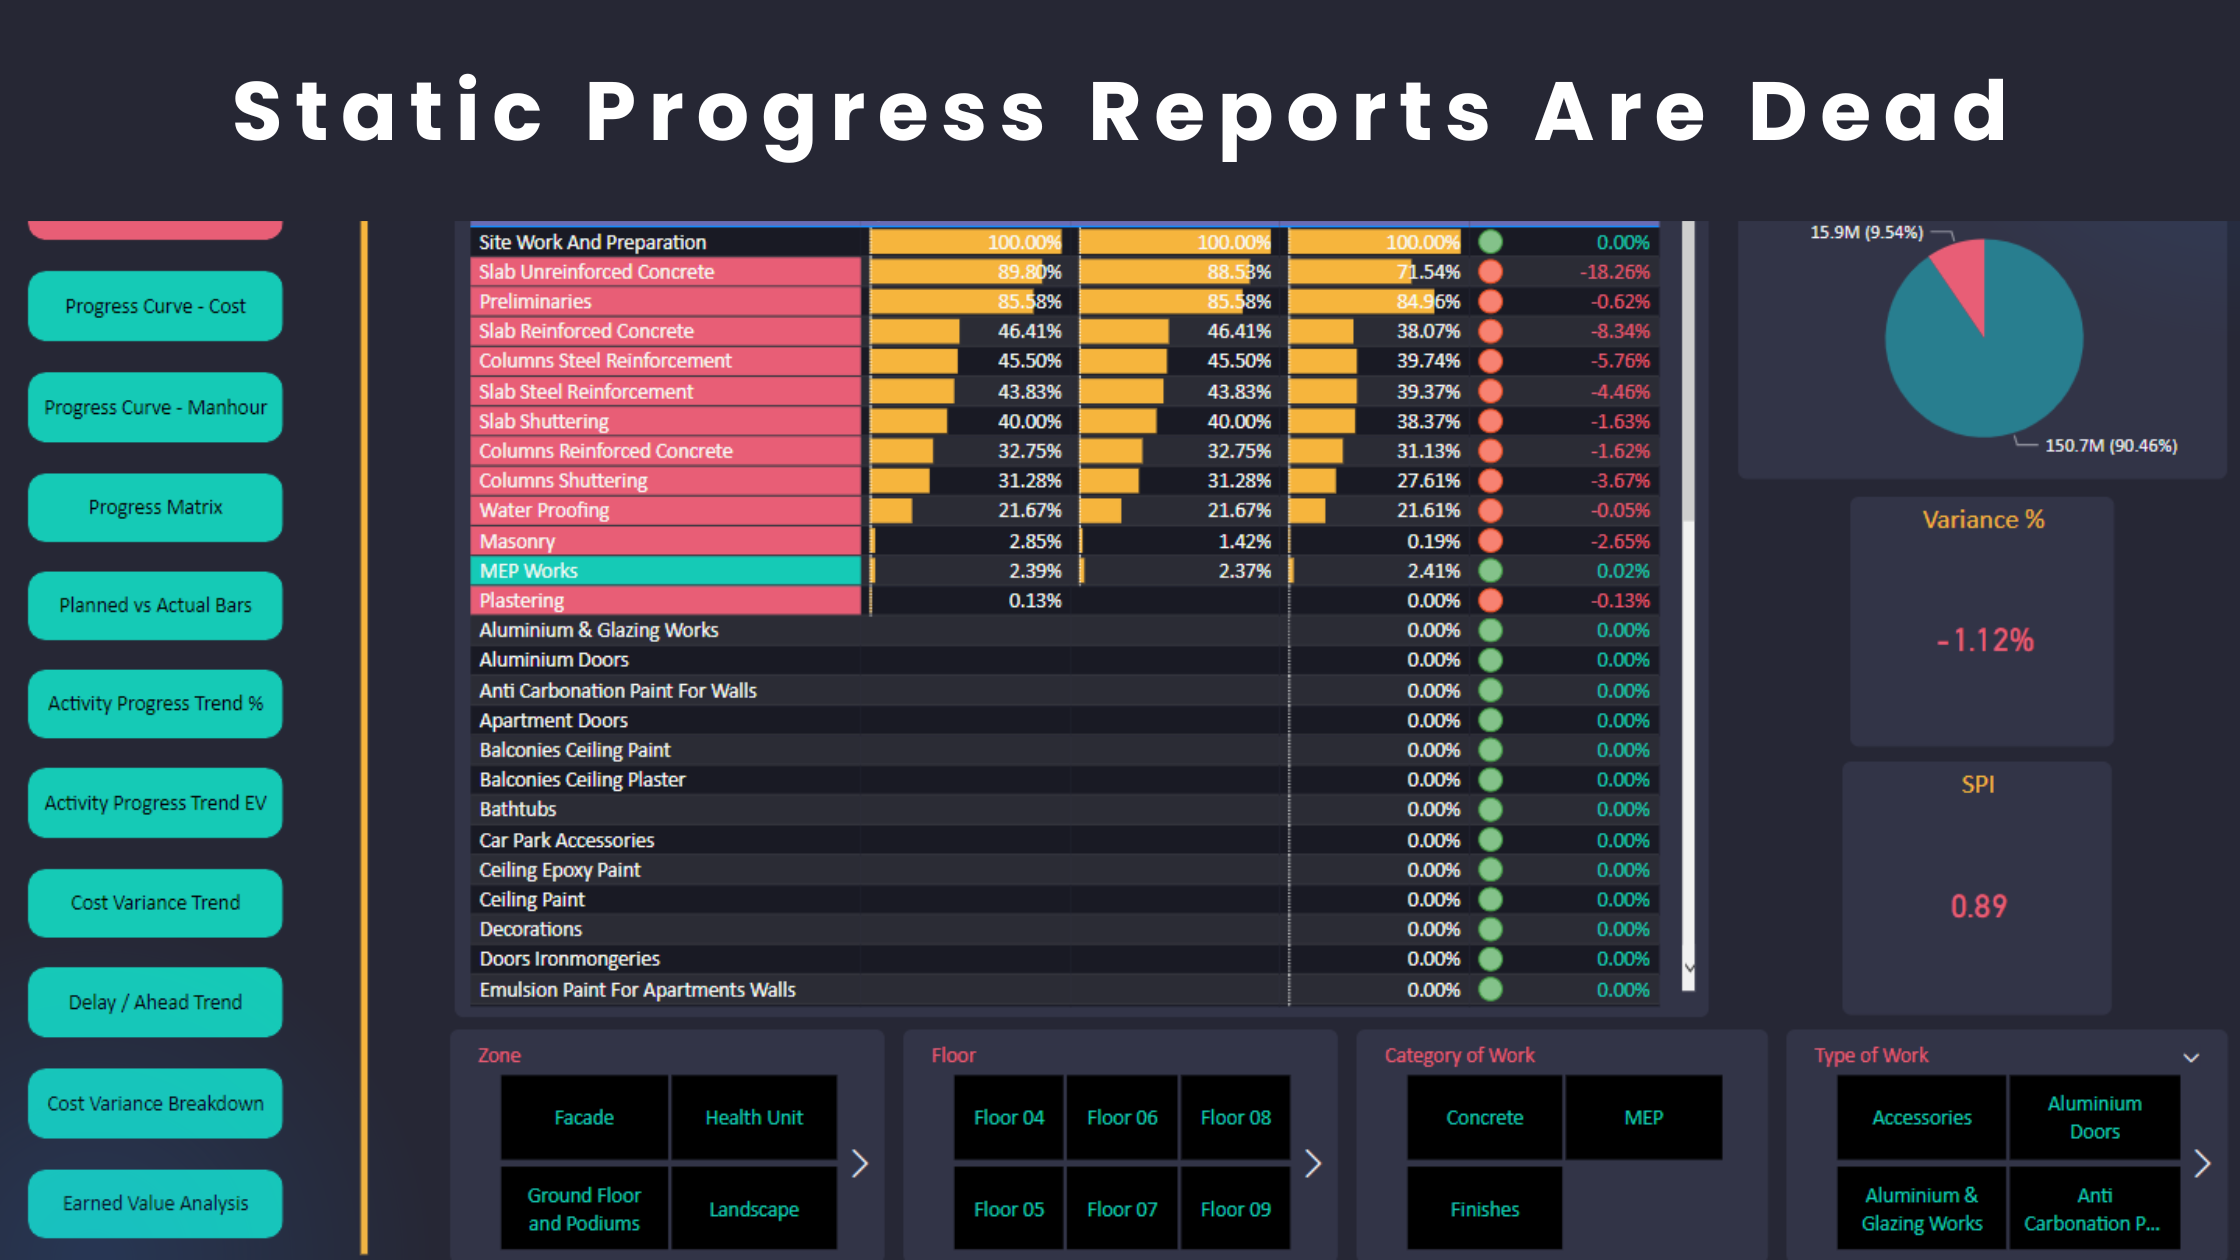
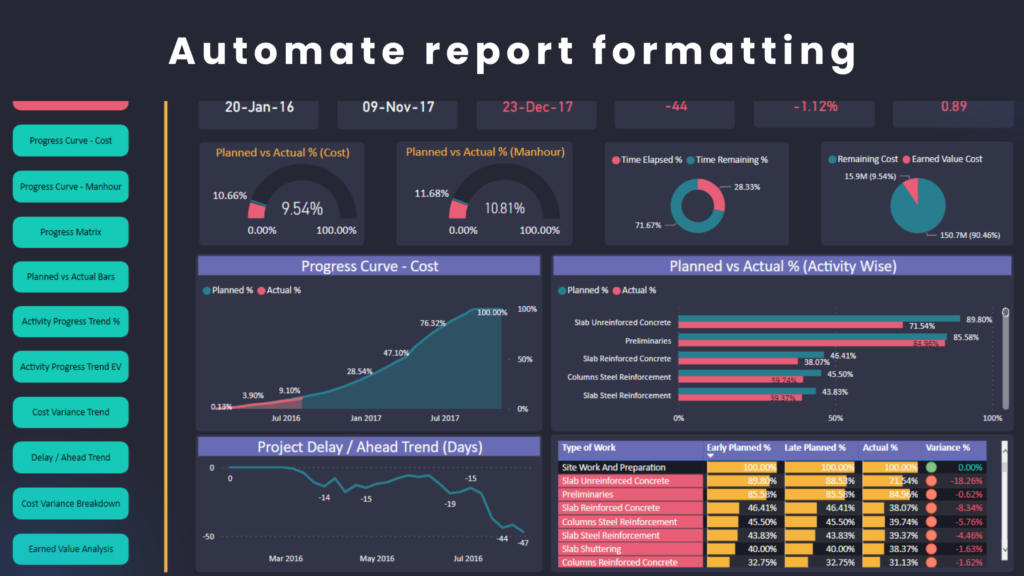
Here are a few examples of progress reports that are developed using Power BI. Pay attention to the consistency in all elements such as font types, colour grades, etc.
In conclusion, planning engineers should find ways to free up their valuable time to focus on high-impact deliverables such as variance analysis, breakdown analysis and activity trends. One of the most time-consuming low-impact activities is formatting. Power BI helps planning engineers automate formatting and prepare professional reports and presentations.
Regards,
Osama Saad, MBA, PMP, PSP, PMI-SP