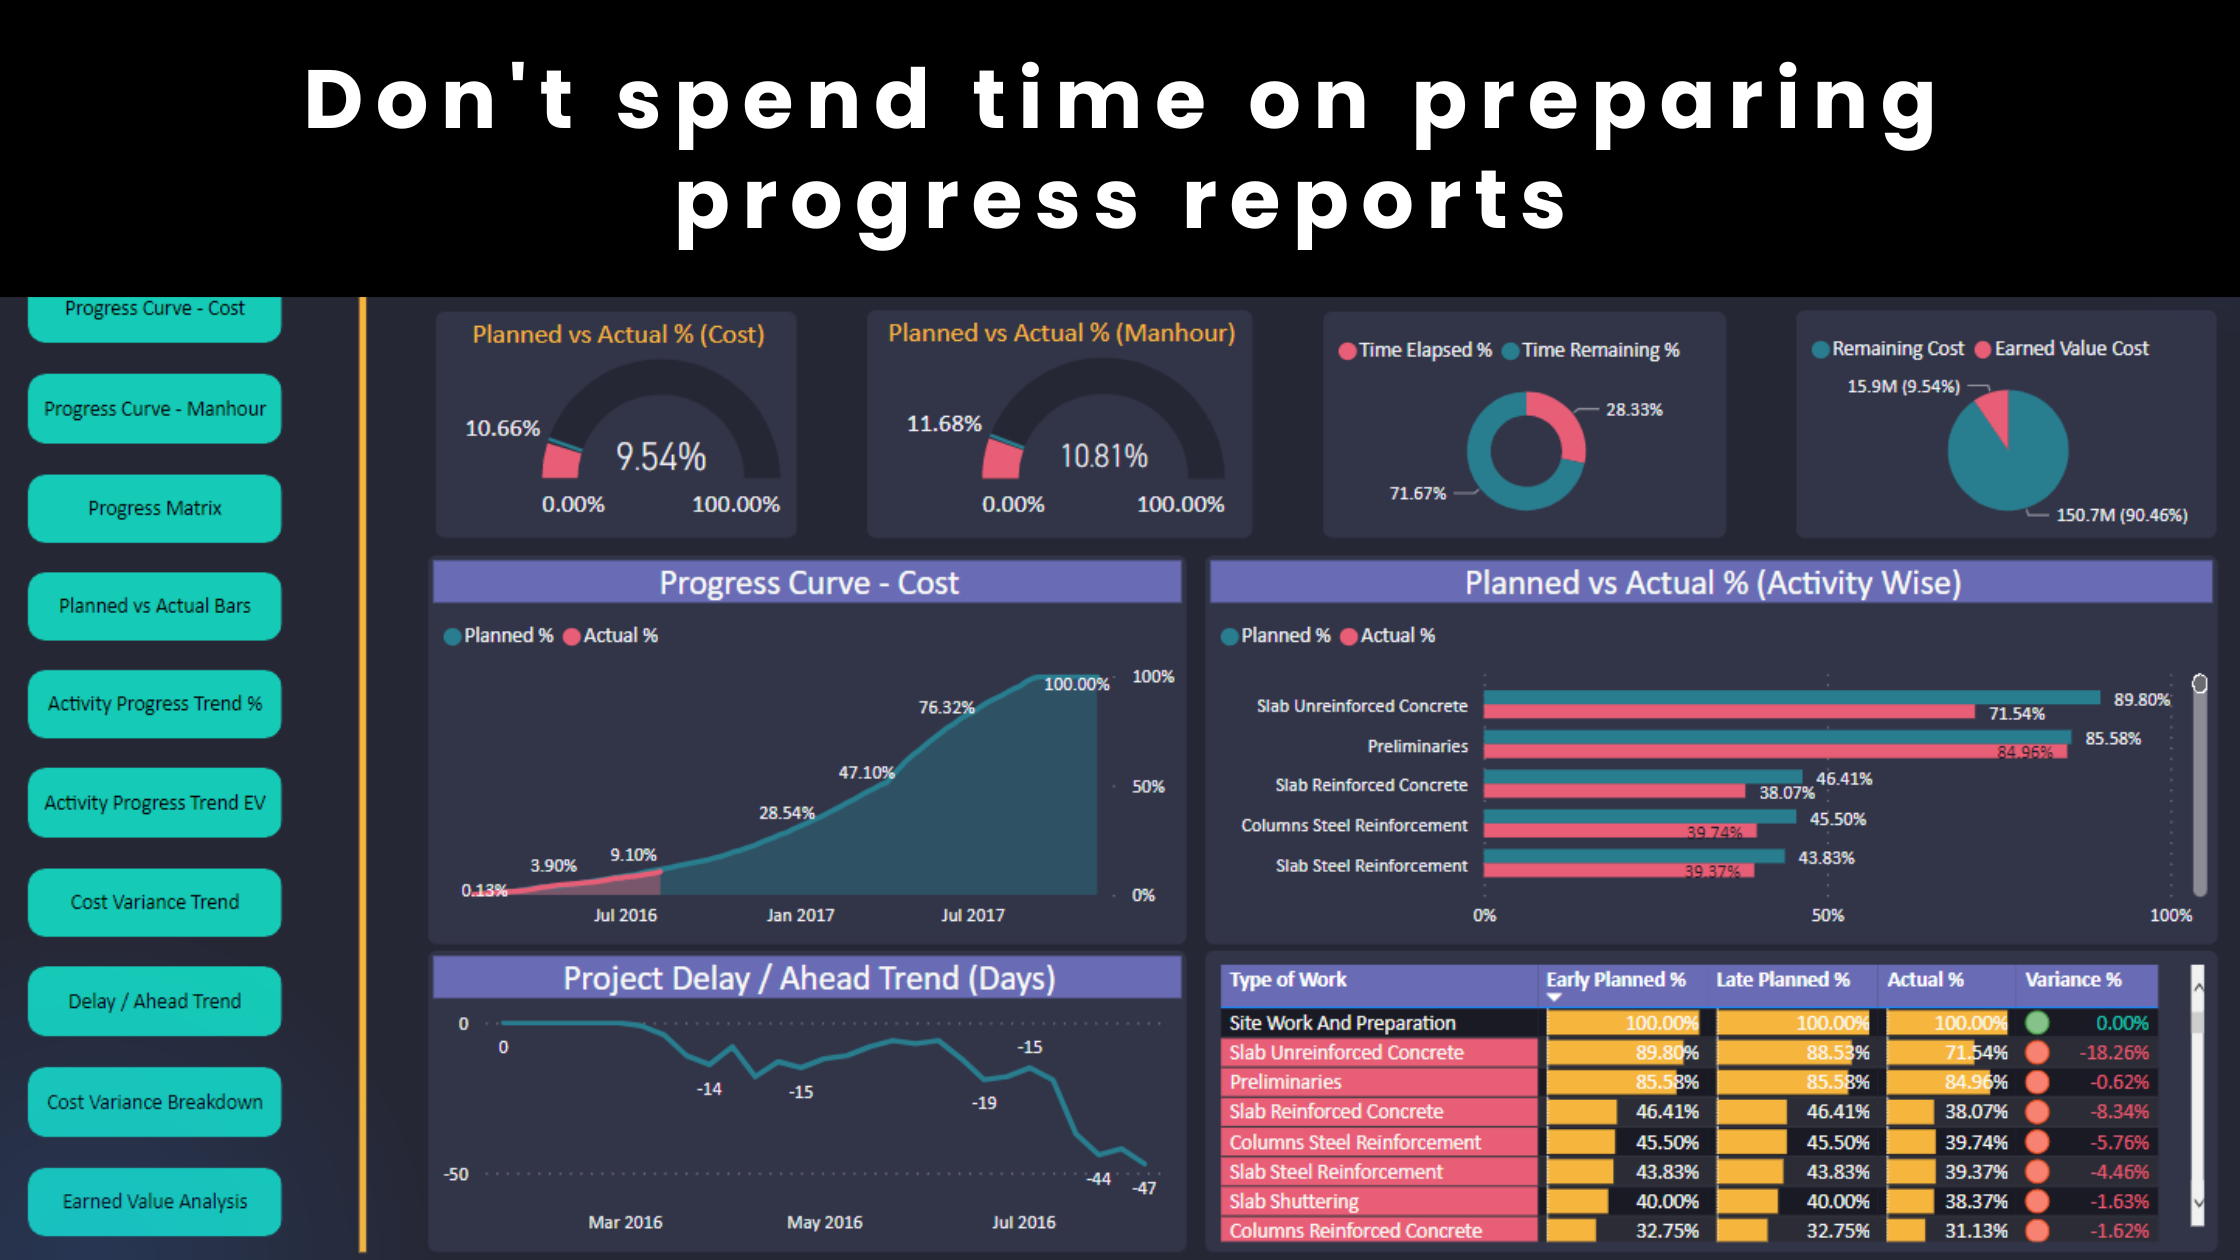
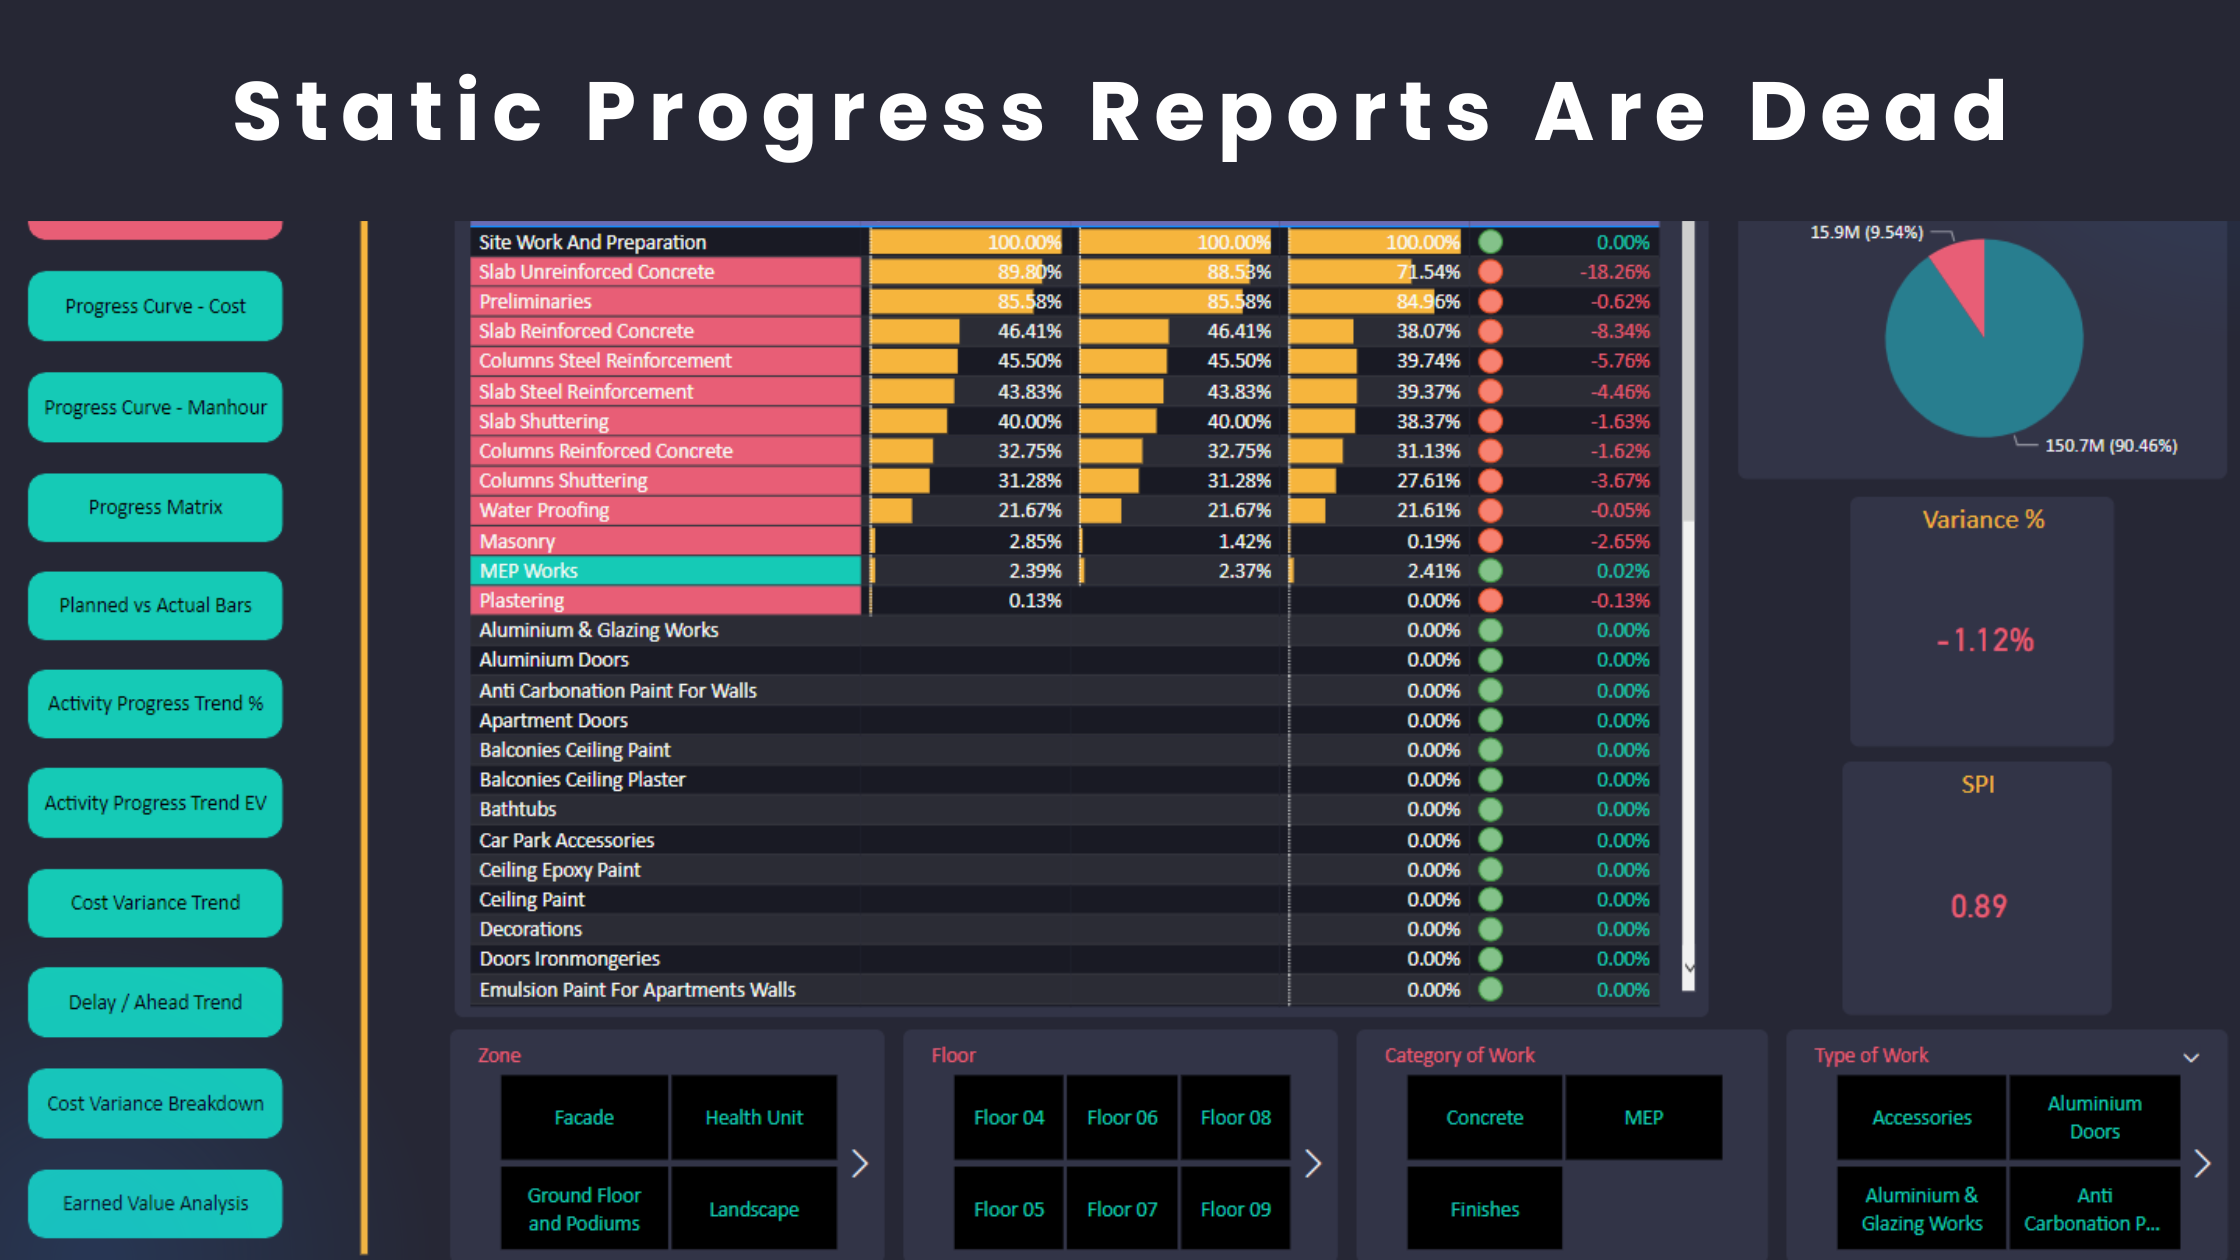
In the complex world of project control, Power BI has emerged as a game-changing tool for data analysis and visualization. Its potential to simplify complexity, deliver actionable insights, perform an interactive analysis and reduce time is unmatched—but only when used correctly. Here are my top 10 tips for leveraging Power BI effectively in project control to ensure your reports are both powerful and reliable.
1️⃣ Understand Your Data
Begin by building separate queries for each main data entry point, such as Baseline, Updates, Activity Codes, or Labor Units Distributions. Segmenting data at this stage reduces the risk of conflicts when combining datasets later.
2️⃣ Define a Star Schema
Simplify your data model with a Star Schema:
- Use IDs like Activity IDs, Activity Code IDs, or Resource IDs as primary keys.
- Avoid snowflake schemas that introduce unnecessary complexity.
In other industries, the data analyst often needs to perform multiple steps to establish the primary keys. We are so lucky to have these IDs in project control that work in our favour.
3️⃣ Optimize Data Types and Size
These steps might look minor but ignoring them will most likely produce errors and misleading results.
- Assign appropriate data types (e.g., Decimals for costs fields, Percentages for the Activity % complete field).
- Remove blank cells to prevent conflicts during calculations. Power BI will recognize blank cells as values and process them.
- Eliminate redundancy—for instance, keep budgeted total cost in only one query to avoid duplications in calculations or processing errors.
4️⃣ Establish Clear Naming Conventions
Clarity is key. Use full, consistent names for tables, columns, and measures.
When deadlines are tight and you are under pressure, clear naming prevents fatal mistakes and ensures that you don’t select other fields by mistake. Instead of abbreviations, descriptive labels can save you.
5️⃣ Singularity is King
Stick to these principles for a more efficient model:
- Use a single data source if possible.
- Favor One-to-Many or Many-to-One relationships over Many-to-Many.
- Set your cross-filter direction to Single rather than Both to maintain control over relationships.
6️⃣ Use More Measures
Rely on measures instead of calculated columns. Measures are optimized for Power BI’s engine which leads to better and even faster performance .
7️⃣ Test and Validate the Model
Test the water. Use a small set of your data (e.g., one small baseline and one update) to prototype and validate your model before scaling up. This approach is particularly helpful for beginners.
8️⃣ Build Your Relationships from Scratch
Disable auto-detect relationships and manually configure them.
This extra effort prevents unintended joins and ensures your model reflects the true logic of your schedule’s data.
9️⃣ Be Humble
Respect the tool, and it will respect you:
- Work with data sources that you are familiar with to make troubleshooting easier in the future.
- Avoid complex DAX expressions and pre-calculate them using measures where possible.
- Focus on creating a reliable, error-free model rather than becoming obsessed with complex configurations.
🔟 Have a checklist
I am big fan of checklists. Don’t forget to have a checklist to review your model to cross-check the above points before finalizing!
By following these principles, you’ll not only enhance your Power BI workflow but also deliver high-value insights that the project team relies on and desperately expects from planning engineers.
Regards,
Osama Saad, MBA, PMP, PSP, CCP, PMI-SP
Learn More!


