If you have been following my content, you know that I am not really a big fan of the traditional P6/Excel type of work in project control. My mission is to change the way we plan and control our projects worldwide. Only then, planning engineers can add more value and become a huge success factor in their projects.
You can’t control what you can’t measure! That’s why progress reports are so important. However, such reports are prepared in different forms for different purposes. Although there are many factors on how to prepare an effective report, I will only explain the value of connecting the drawings to your project control model in this article. Here are the benefits of establishing this connection using Power BI:

1- Convenience
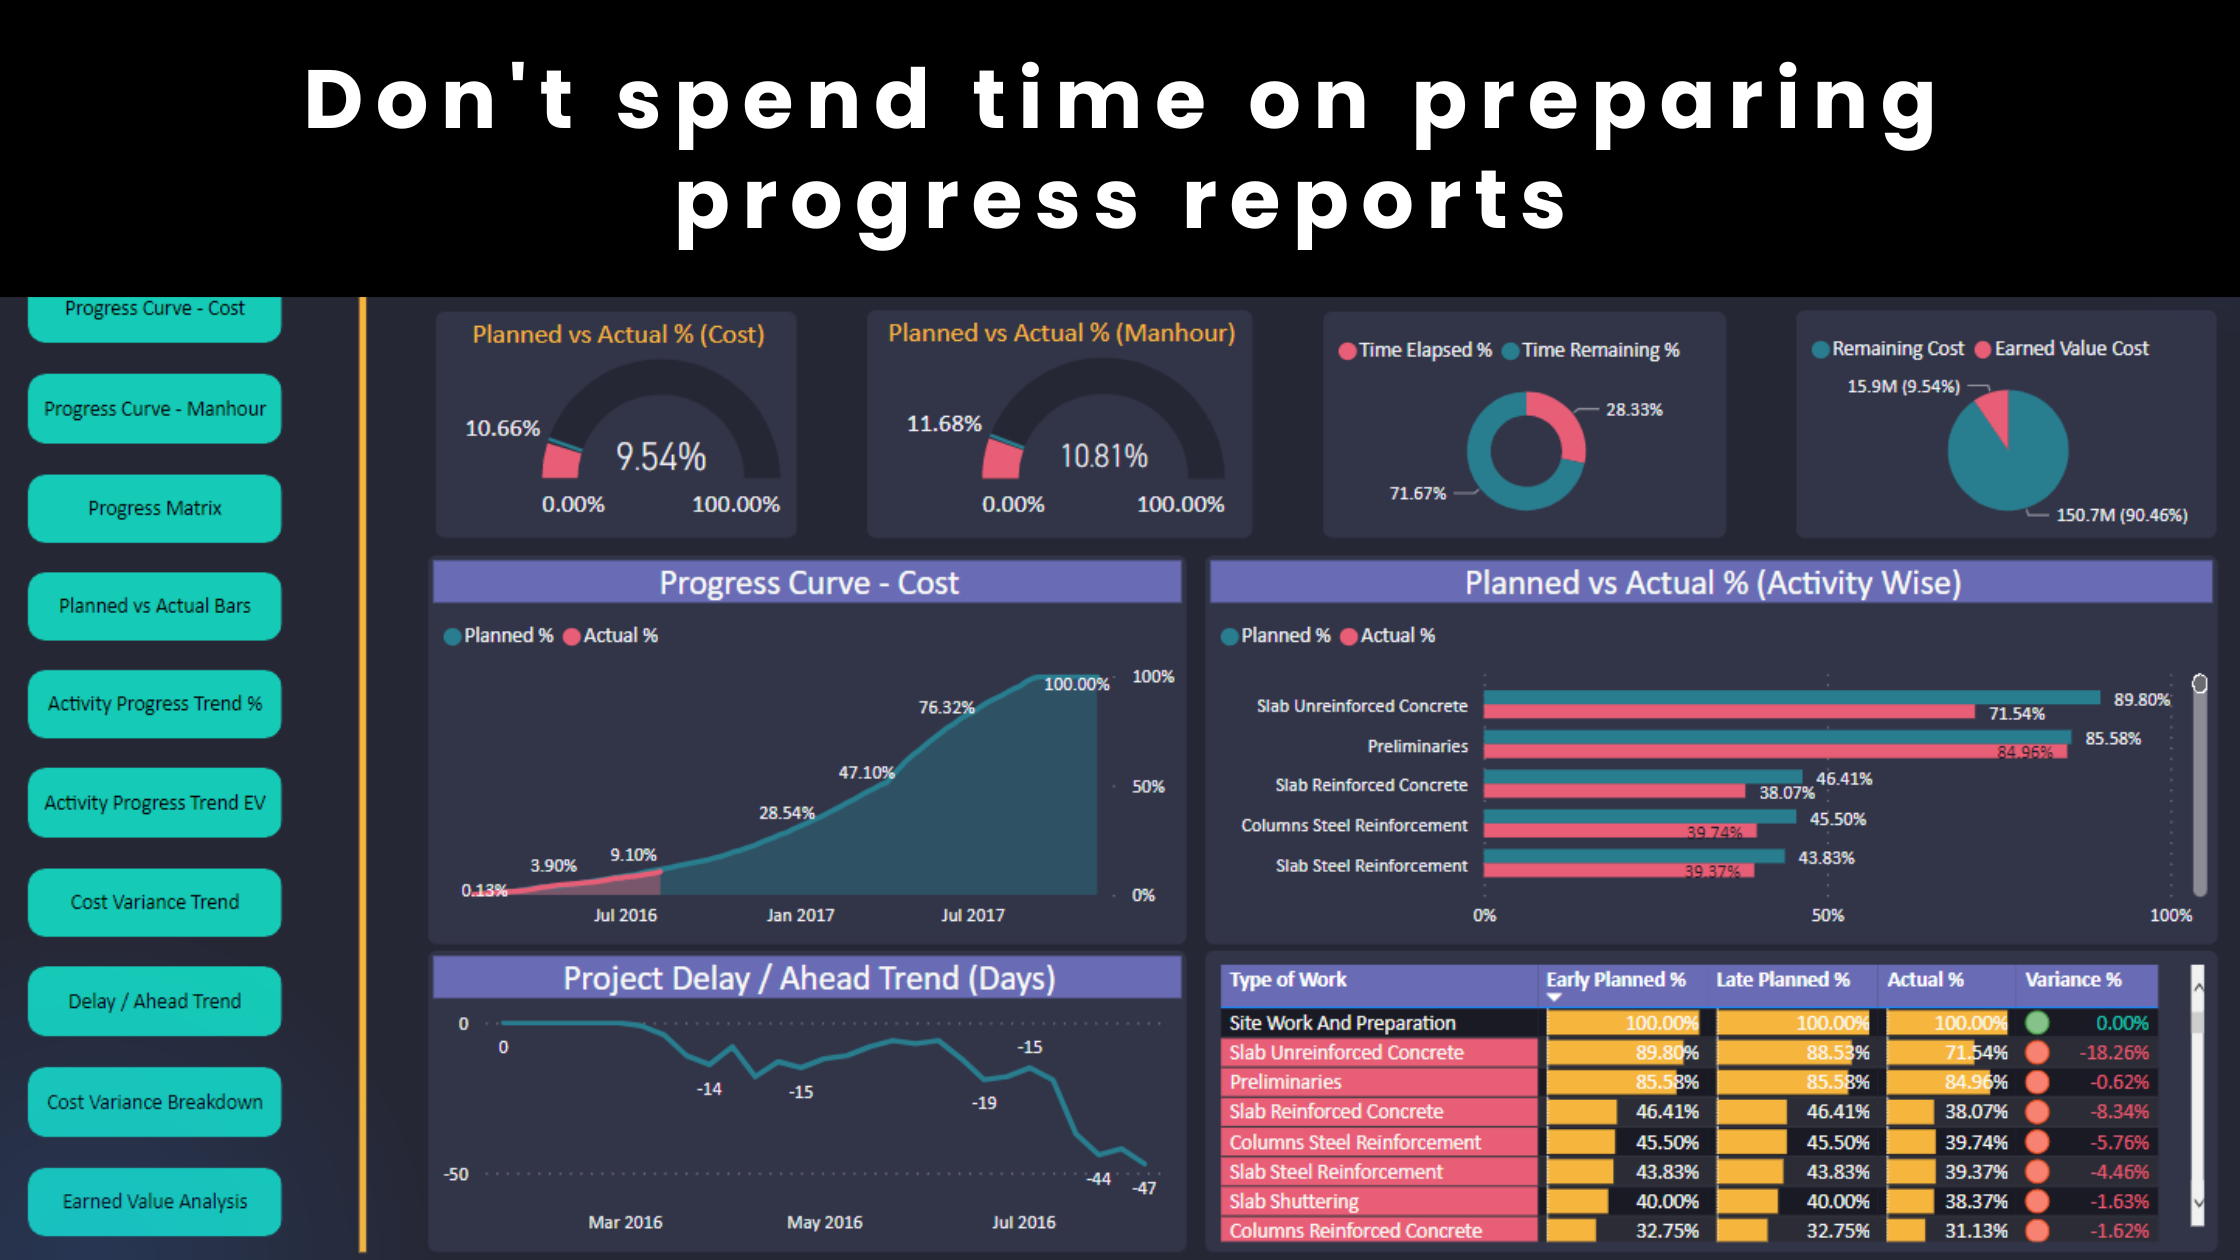
It is more effective to view the project drawings and generate a comprehensive report for any area with a click of a button. This is particularly helpful for management and key decision makers because they are not typically the ones who will read the 200 pages report that you prepared. In a meeting, they will have many questions and expect quick answers. Power BI allows you to build dashboards and provide instant answers within seconds. All you need is a laptop.
2- Flexibility
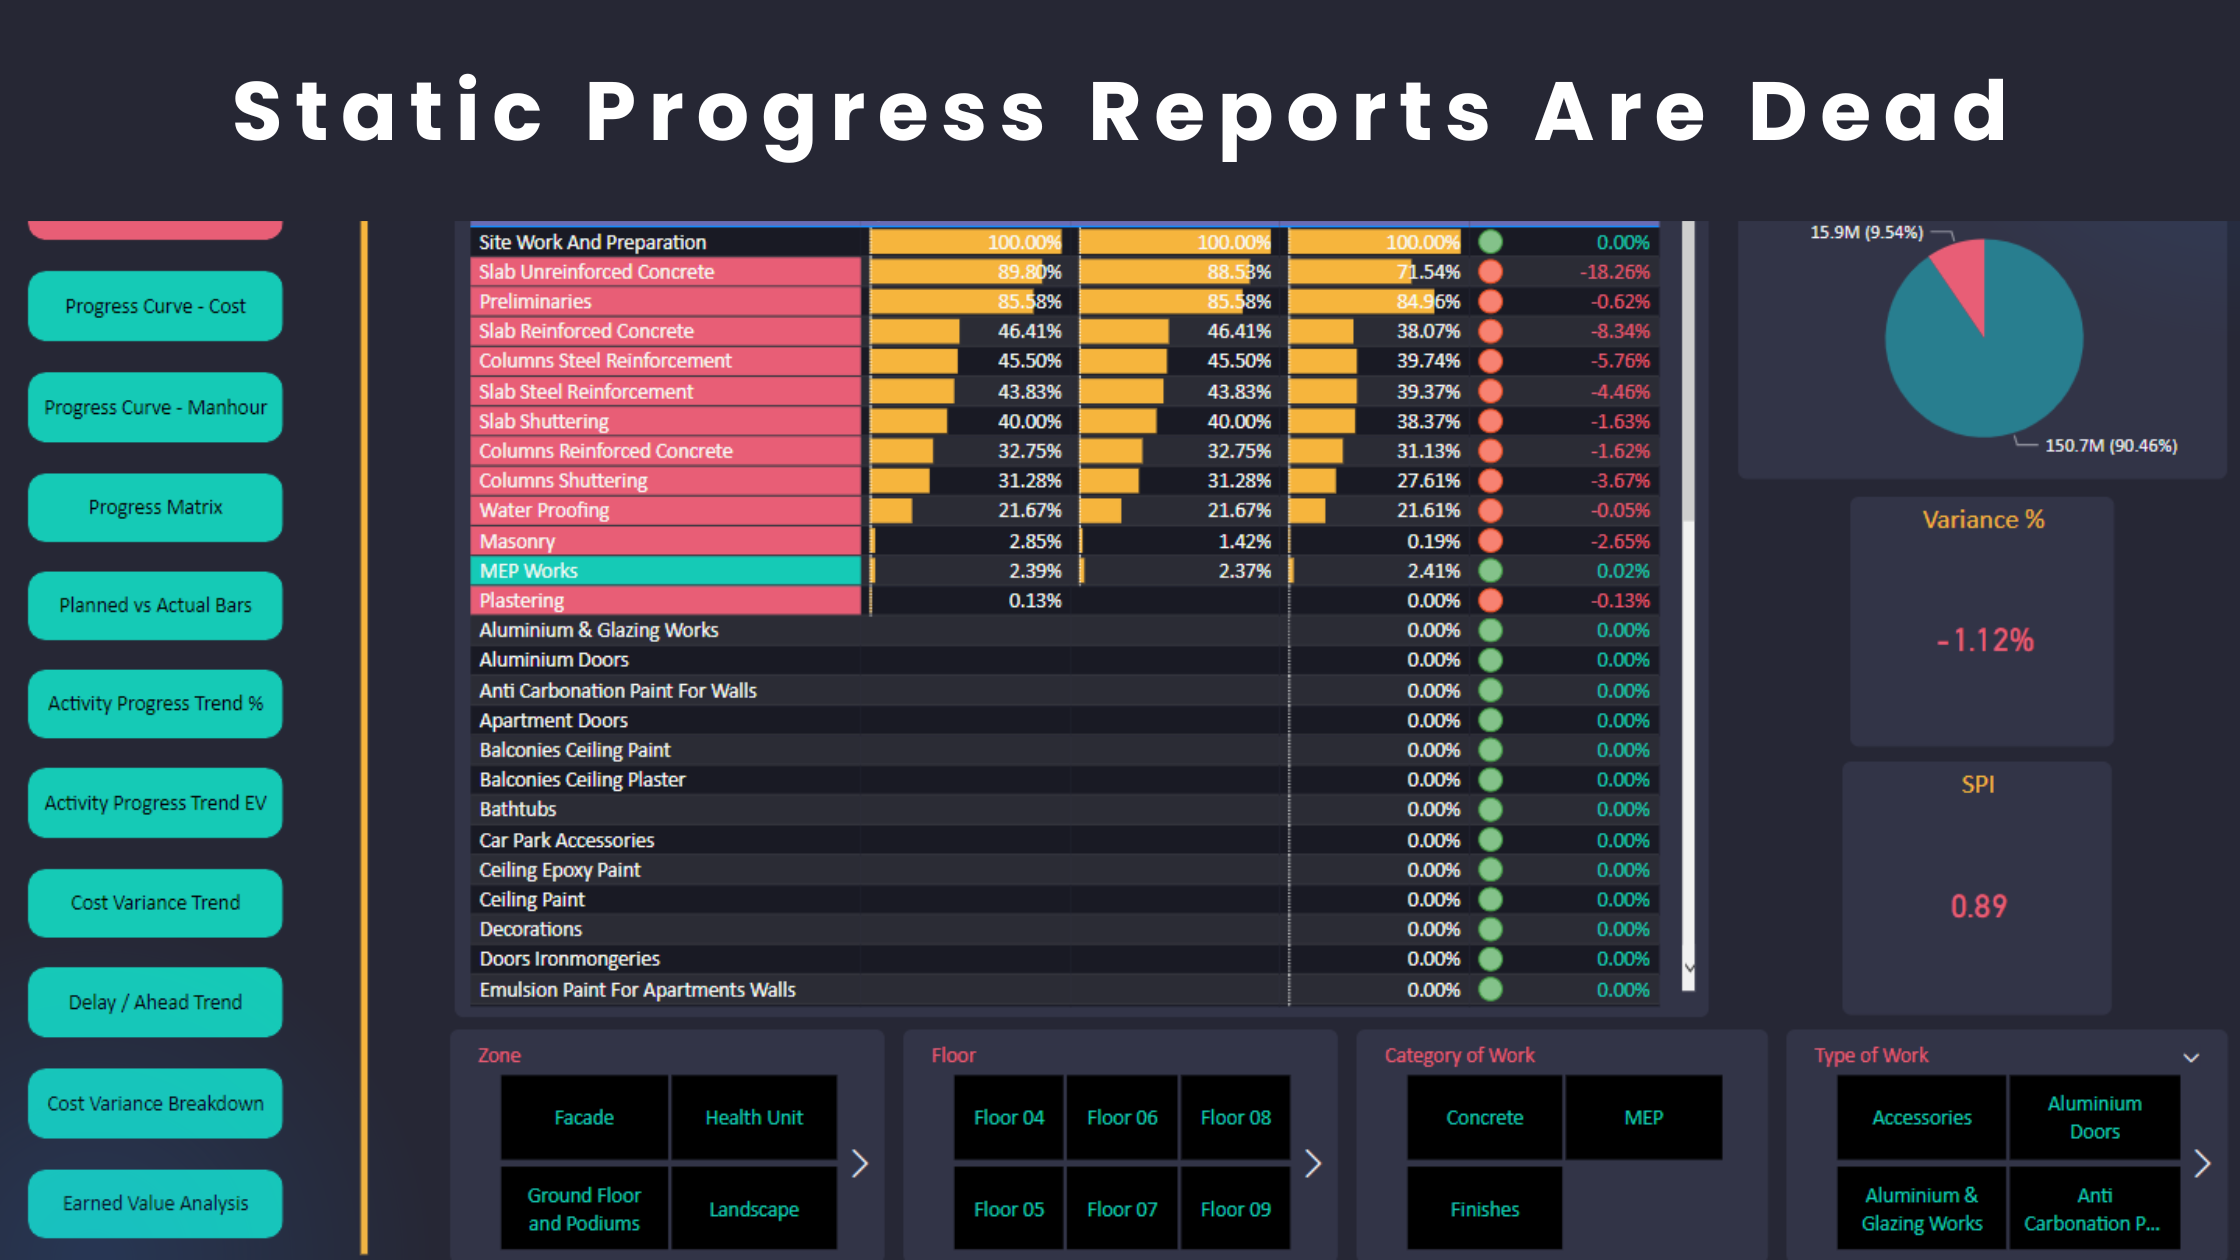
If you implement the traditional P6/Excel type of work, your report is probably static. This means that both the planning engineers and the reviewers will have limited ability in making decisions because their analysis cannot go beyond what they see in the report. On the other hand, if you have the project layout connected with your “dynamic” model, everyone has the potential to analyze other areas which they wouldn’t have thought of before. Moreover, they can dig deeper and identify more causes of delays. In addition, they can review the planned work for other areas and have effective preparation in advance. This flexibility can’t be achieved with static reports or where the project drawings aren’t a part of the model.
3- Efficiency
Any data analytics model should be designed and developed to reduce friction. If I receive more data, inputs or report modification requests, I don’t want to spend the whole afternoon revising and customizing the report. That’s not effective. Power BI allows you to customize your drawings-based report within seconds. The above image is only an example but you can add as many parameters, elements and sections as you want with a “drag and drop” feature inside Power BI. Moreover, you can apply any necessary filters and immediately have your PDF reports or PowerPoint presentation ready. You can also save hours on report formatting by doing so.
4- Speed
It takes less than 30 seconds to update the progress data inside Power BI after the schedule update is completed. The data are also synchronized with the project drawings/layout so you don’t need to do any additional work after each schedule update. This is another reason why we should apply more automation and leverage in project control.
5- Cost
You can do all of the above using Power BI which is free software for the most part. The process of connecting the drawings with the schedule is seamless compared to other similar “expensive” software solutions in the market. Power BI can also help companies save money in some ways.
6- Career
In my experience, there are very few planning engineers who use this type of connection in their work. If you establish this connection, you look more professional in front of management and clients. Moreover, you can attach some snapshots with your CV to stand out from the competition. You will also get shortlisted for vacancies listed by reputable organizations.
learn More!
Check out our comprehensive courses
Regards,
Osama Saad, MBA, PMP, PSP, PMI-SP


