Breakdown analysis is essential to help projects move forward. If your project is falling behind by $1M that you should have collected by now, the next logical questions would be:
- “Where is the shortfall coming from?”
- “Which activities should I have completed by now that caused the payment deficit, and by how much?”
A planning engineer might need to present the breakdown analysis of such negative variance and articulate the contributing factors that account for the shortfall, preferably sorted by impact from highest to lowest. That’s only one example that illustrates the need of conducting a breakdown analysis. Similarly, the planning engineer might need to demonstrate the breakdown of the project earned value cost, budgeted total cost, labor units, etc.
The Problem
Planning Engineers struggle with the breakdown analysis for a variety of reasons. To better explain the complications associated with this type of analysis, here is what a Planning Engineer would typically do to produce a breakdown report in project control.
- Import the P6 XER file that corresponds to the data date on which you would like to prepare the breakdown analysis.
- Assign the Baseline Schedule.
- Apply any necessary filters (e.g. activity codes, activity description, WBS, etc) that help you achieve the desired outcome.
- Copy the data into Excel.
- Apply multiple Excel formulas.
- Review the formulas links and results.
- Format the results in a report.
As you can see, the above cycle is a time-consuming and complicated process. Moreover, a breakdown analysis is required more often than you think. Whether the breakdown is needed as a part of your own analysis or because it is requested by project stakeholders. Planning Engineers don’t have the time, energy and resources to fulfill such deliverables, especially if the analysis is requested several times in a day or a week, as necessary.
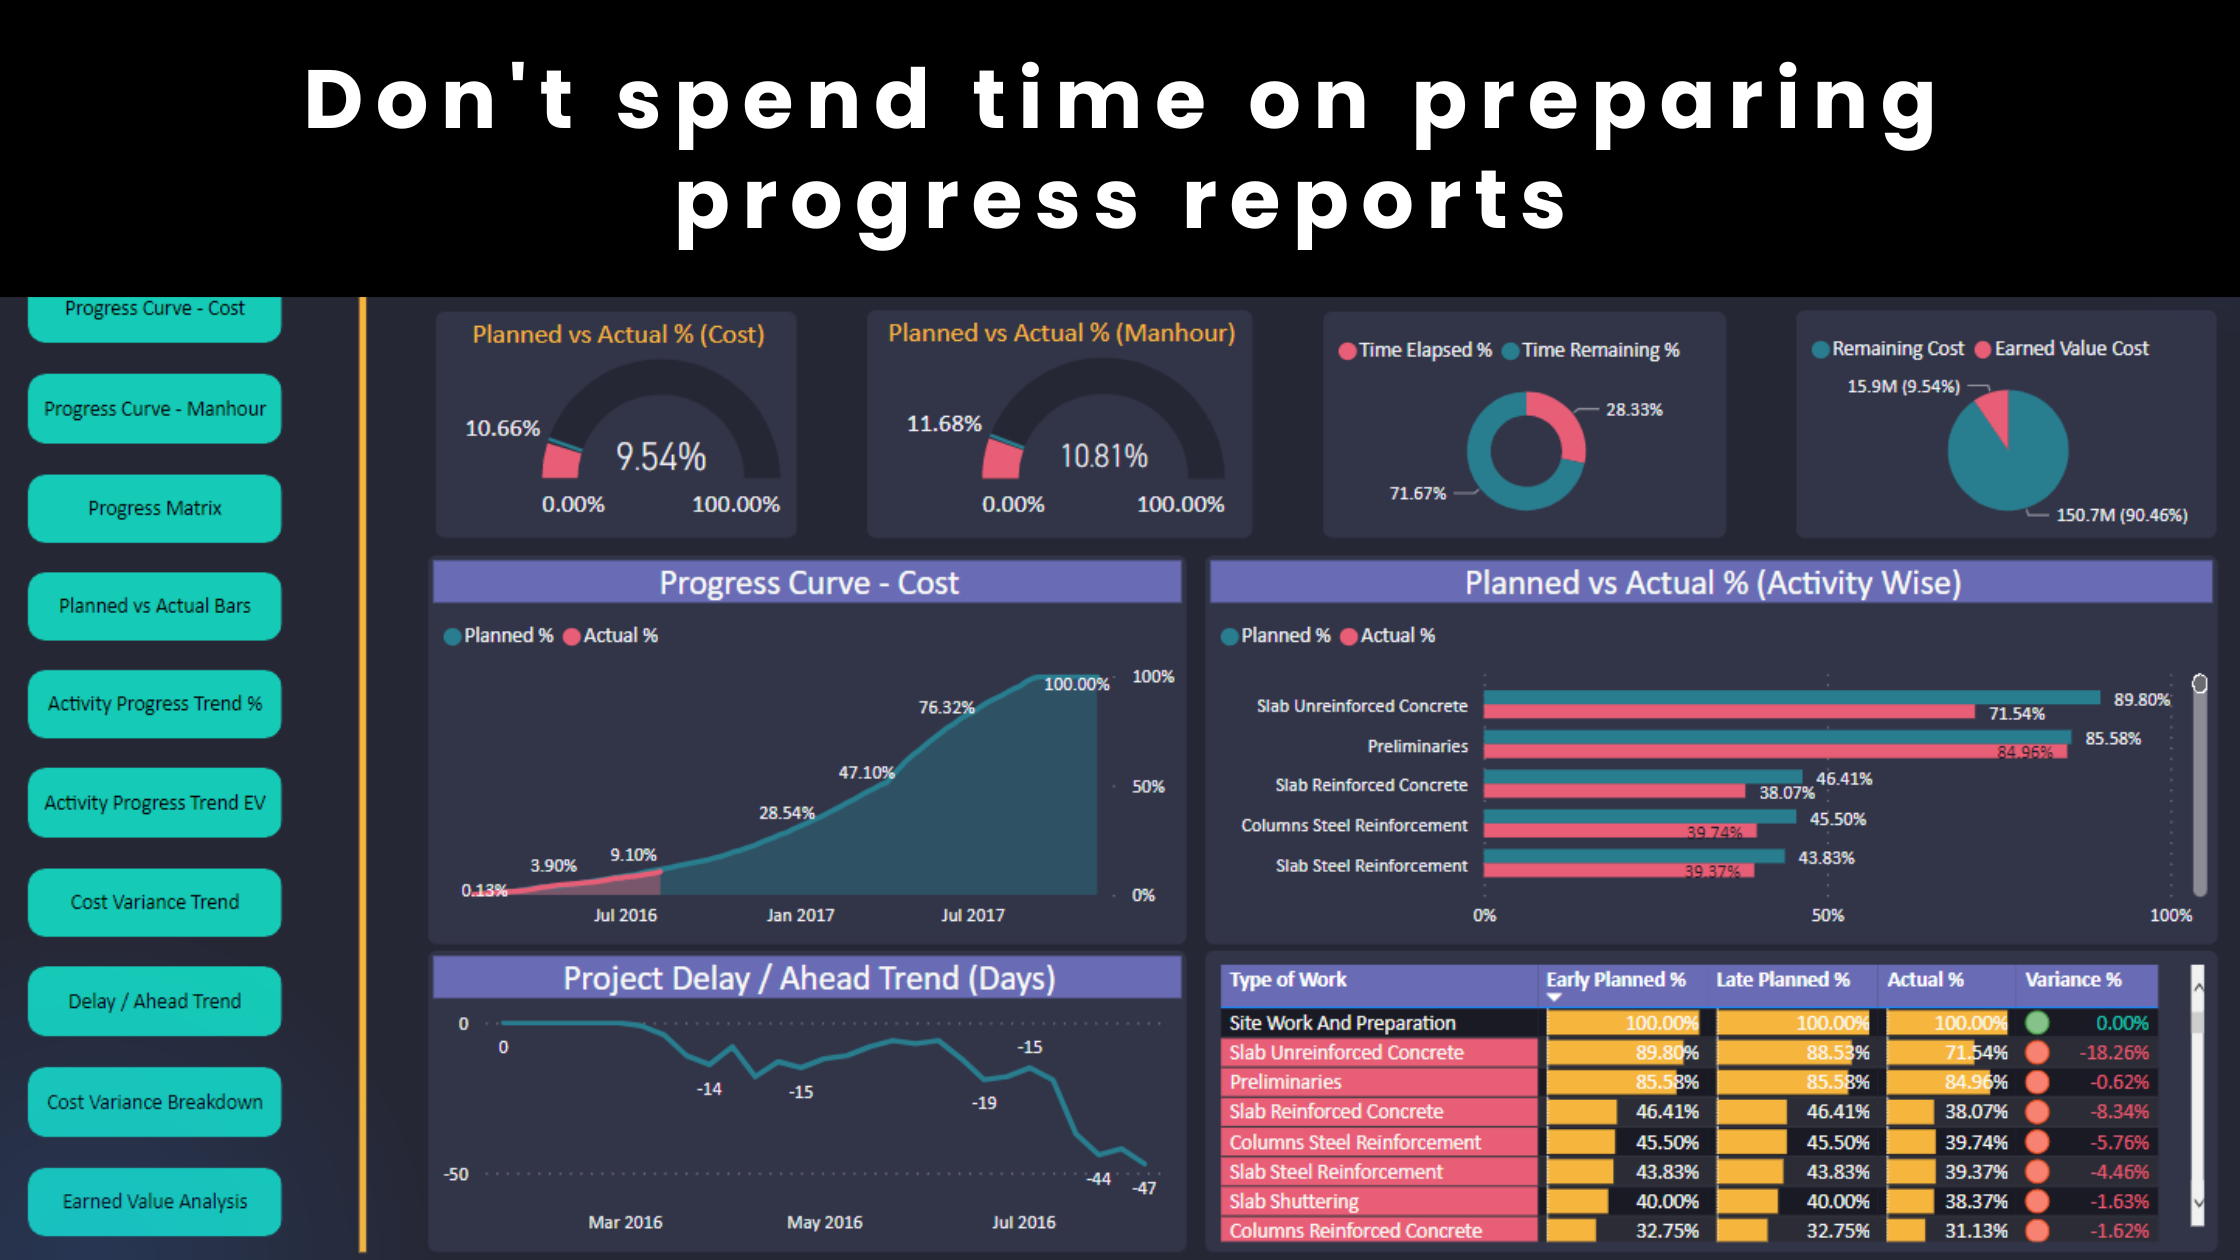
The Solution
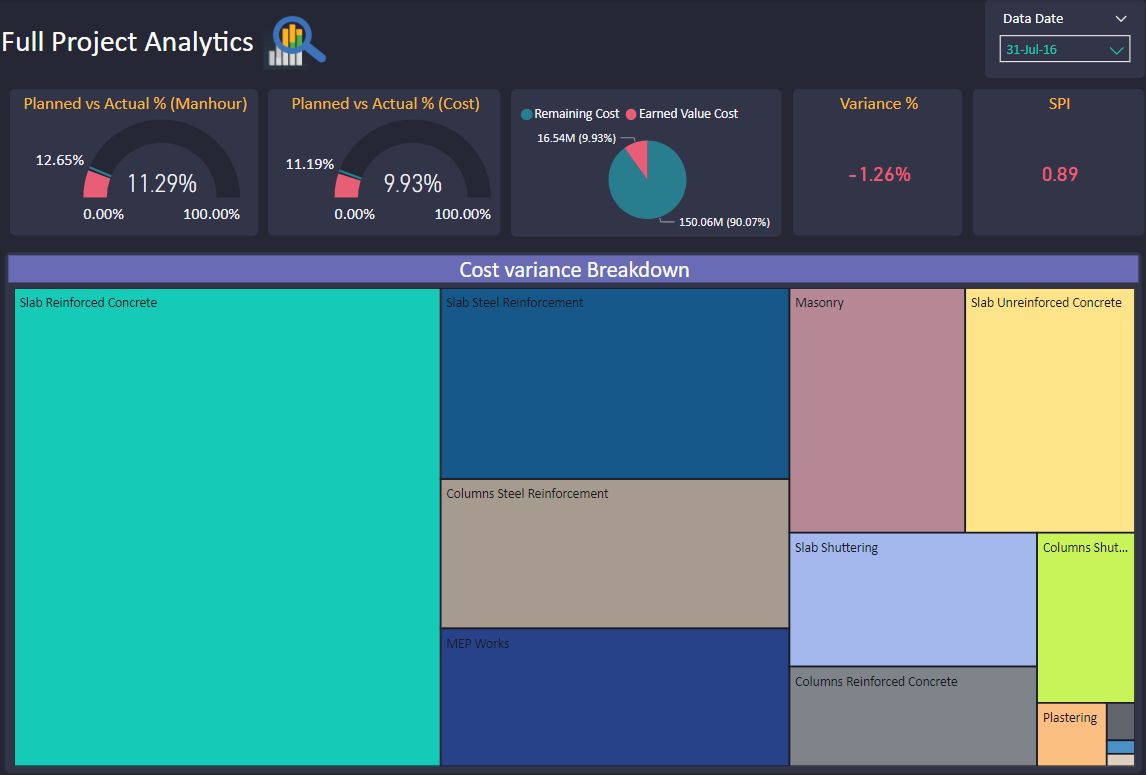
Planning Engineers need better tools and systems that generate the results in a seamless way; a model that is developed to meet the speed, convenience, reliability, reporting and presentation requirements. Planning Engineers can use Power BI to create an interactive breakdown report with A CLICK OF A BUTTON. They can perform an in-depth breakdown analysis and produce the associated dashboards for any project area within seconds. I am a practical person so let me show you what I mean here in practice. In the below image, I used cost variance as an example. However, you can conduct the analysis for any field of your choice (Earned Value, Budgeted Total Cost, Budgeted Labor Units or whatever you want). Here are some of Power BI benefits for breakdown analysis in project control.
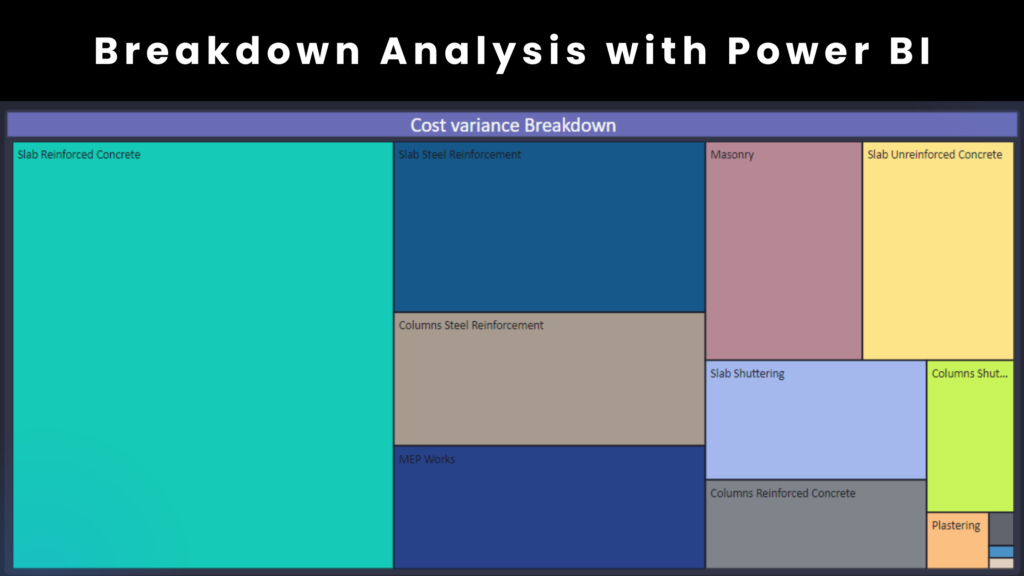
1- The visualization will split into rectangles that are ordered quantitatively based on the relative strength of the value of each area
2- Each area is given a unique color to facilitate your review.
3- Conduct the analysis on any data date of your choice with a click of a button.
4- Hover over any area to see additional information that can help you in your analysis (e.g. the exact figure of Cost variance, Earned Value, Actual Start, Planned Cost, Labor Units or whatever you want).
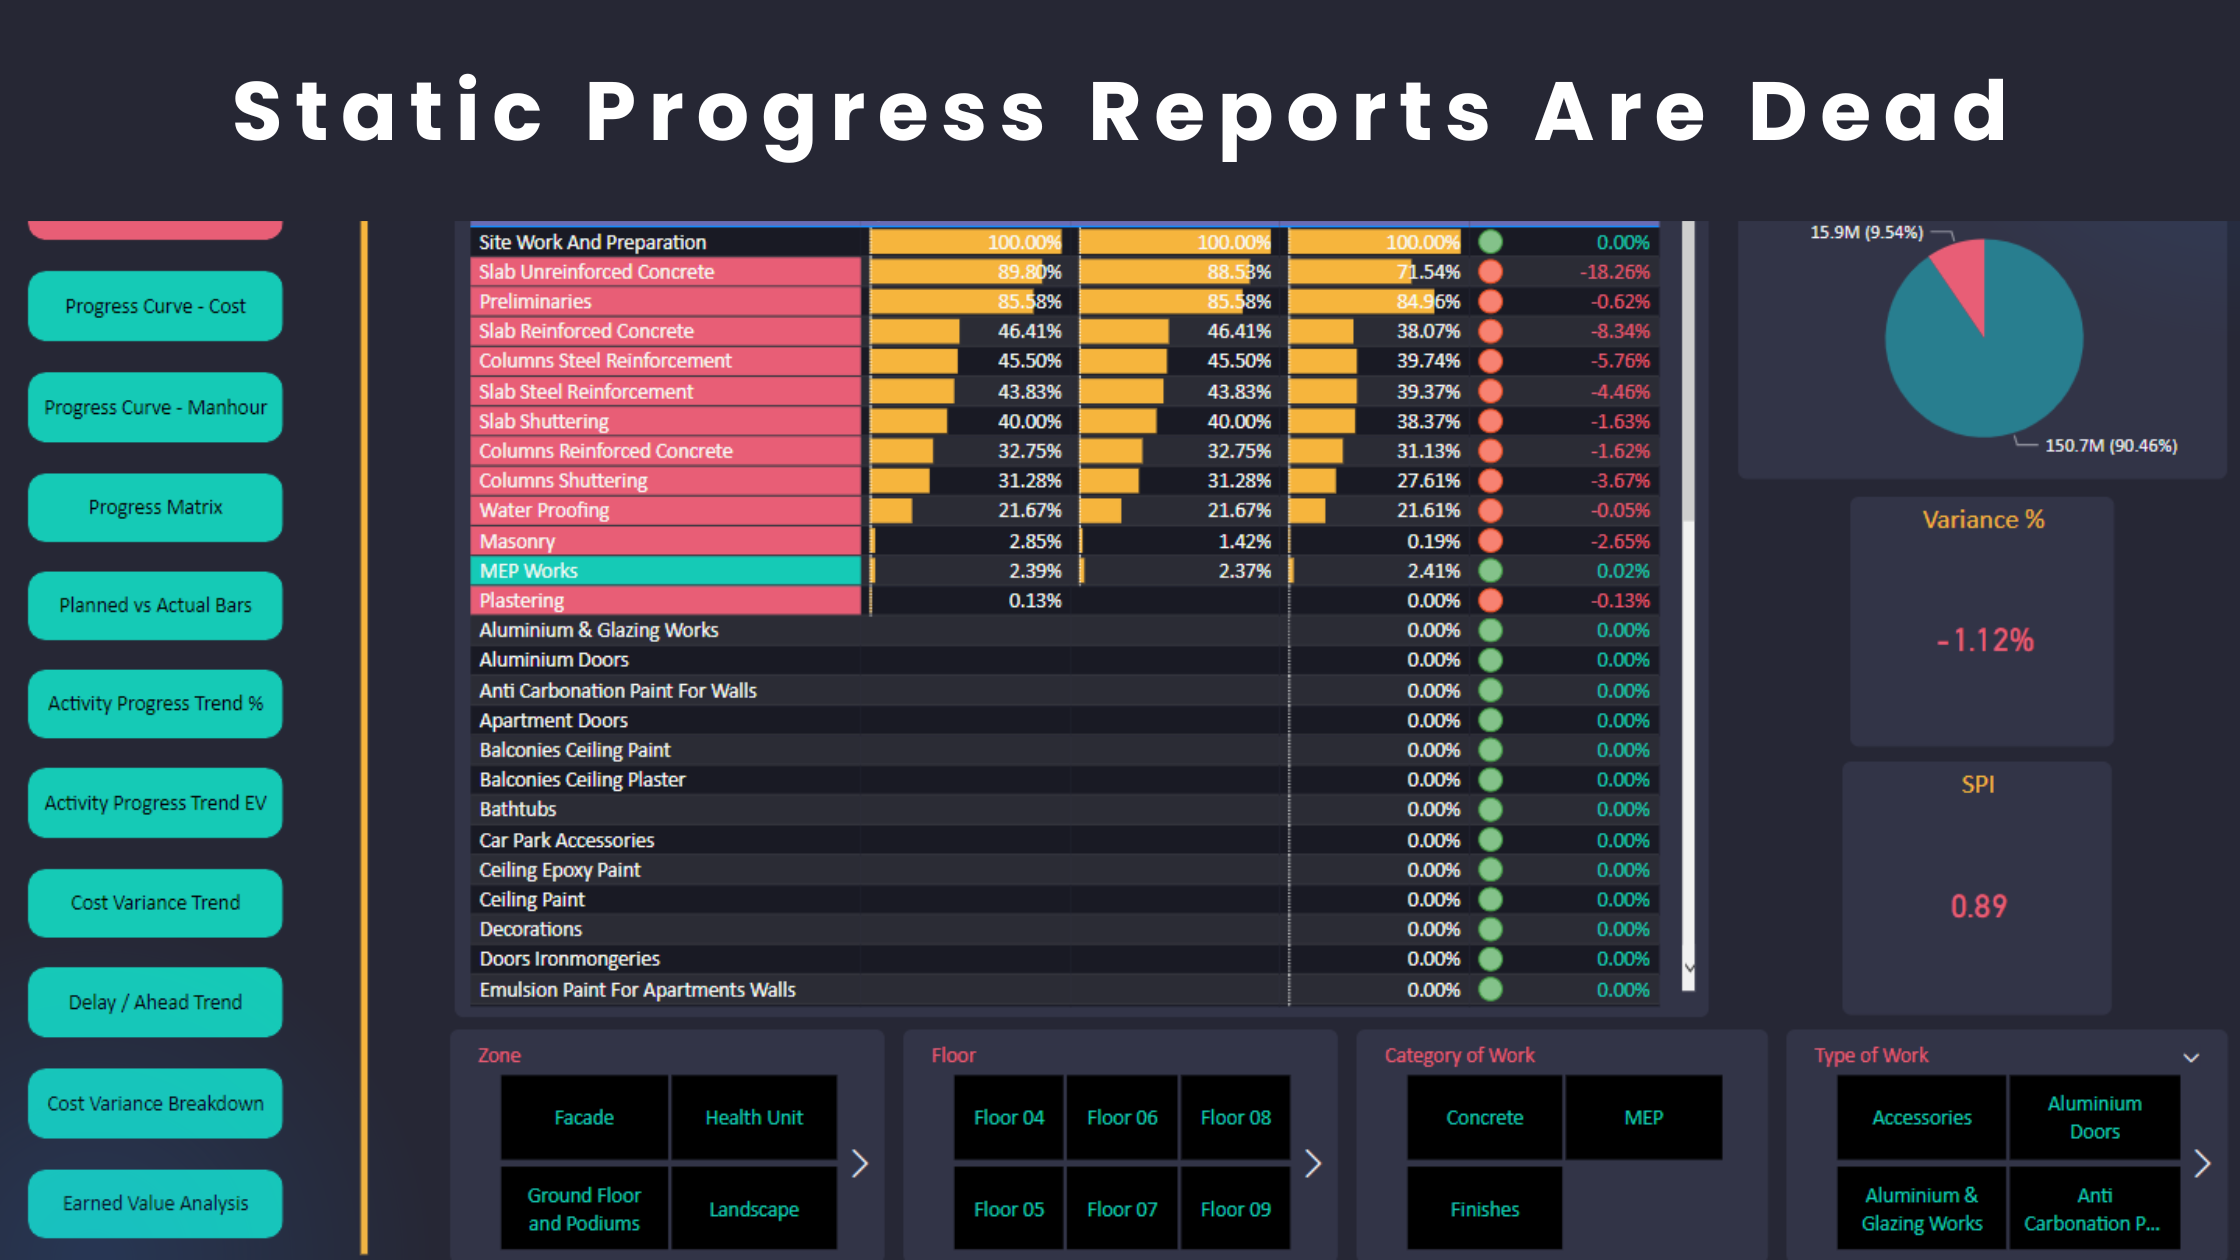
5- The whole model is interactive. Click on any area and other indicators such as Planned vs Actual %, Variance %, SPI will be automatically updated based on your selection.
Comparison benefits
Not only can you use Power BI to analyze the breakdown on a certain data date but also compare the results of another data date. It allows the planning engineer and project stakeholders to gain valuable insights as a part of the progress analysis. Let me illustrate that with an example.
The below image shows the cost variance breakdown on a specific data date. The “slab reinforced concrete” work ranked fourth as the highest contributing factor to the overall cost variance.

Two weeks after, the same activity ranked first as shown in the below image. This means that the delays associated with “slab reinforced concrete” escalated over two weeks period and compounded enough to promote this work category as the highest contributing factor. How many planning engineers do you know who can perform similar in-depth analyses? Unfortunately, you don’t learn these skills from a book or a certification.
Planning Engineers are expected to provide this kind of value to help their project move forward and make a remarkable contribution to its success. Planning Engineers fall into the trap of believing that advanced excel will solve all problems in project control. This might have worked 20 years ago. However, as projects have become more complex, planning engineers need to learn data analytics and use technology leverage tools such as Power BI to manage their projects. This is a tough red pill to swallow because this is not the norm “yet”. Finally, planning engineers who innovate better systems and develop unique methods to fulfill the project requirements will have better career prospects as a reward for getting outside their comfort zone.
Regards,
Osama Saad, MBA, PMP, PSP, PMI-SP
Learn More!