It is very easy to make mistakes and generate tons of misleading data in Power BI if you don’t know what you are doing. Data analytics is a specialization area in which many people pursue a whole career. Planning Engineers are encouraged to focus on improving their P6 and Excel skills to prepare their reports and do their job. However, if you are not using Power BI, I can assure you that you feel overwhelmed with your work. I also know that you are drowning in the data and not swimming for insights. As the data analytics domain is not popular among planning engineers, it is easy to struggle with Power BI and make mistakes, especially at the beginning. Here are the most common Power BI mistakes that planners make.
1- Primary and Foreign Keys
Your model will ideally consist of multiple queries for different purposes (e.g. Activity Codes, Progress Data, Cost and labor assignments, etc). Each query should have a primary key which is a unique identifier that all other fields in the same query can correspond to. Here are a few examples.
Baseline Query
This may include
- Activity ID (it is a unique identifier and therefore can be primary).
- Activity Description (Foreign)
- Budgeted Total Cost (Foreign).
Activity Code Query
- Activity Code ID (Primary)
- Activity Code Description (foreign)
You must set the primary and foreign keys properly so that the model can process your requests accurately.
2- Duplication of Fields
This mistake is very common. Engineers who lack data analytics knowledge show the same field in multiple queries. For example, they may populate the “Budgeted Total Cost” as a foreign key in two different queries. This can be disastrous in your model and there will be a high chance that your interactive report is not generating the expected results because the configuration is not set up properly. Avoidance of field duplications is key and aligns with the data normalization principles.
3- It is not Excel
Yes, there is an intersection between Excel and Power BI but they are quite different. For example, Pivot Tables in Excel are similar to the Queries in Power BI. Moreover, the Power Pivot in Excel is similar to the model relationships in Power BI. However, both function in an entirely different way. In Excel, you can deal with individual cells (e.g. sum the values located in two different cells). On the contrary, Power BI doesn’t recognize individual cells and only deals with rows and columns. Many planning engineers don’t understand this concept and even worse, they try to construct the model in a way that will facilitate the return of individual cells because it brings the excel familiar. Hence, this can cause misleading results.
4- Cardinality
Many planners choose to have (many to many) relationships in their model because why not? It feels safe. However, I always construct my model to have “one to many” or “many to one” relationships. It is also a natural outcome when the primary and foreign keys are set properly.
Why do you need data analytics in project control?
Data analytics is a specialization area but you don’t have to master every aspect. You only need to understand the principles so you can get by. The effective implementation of data analytics in project control can help you:
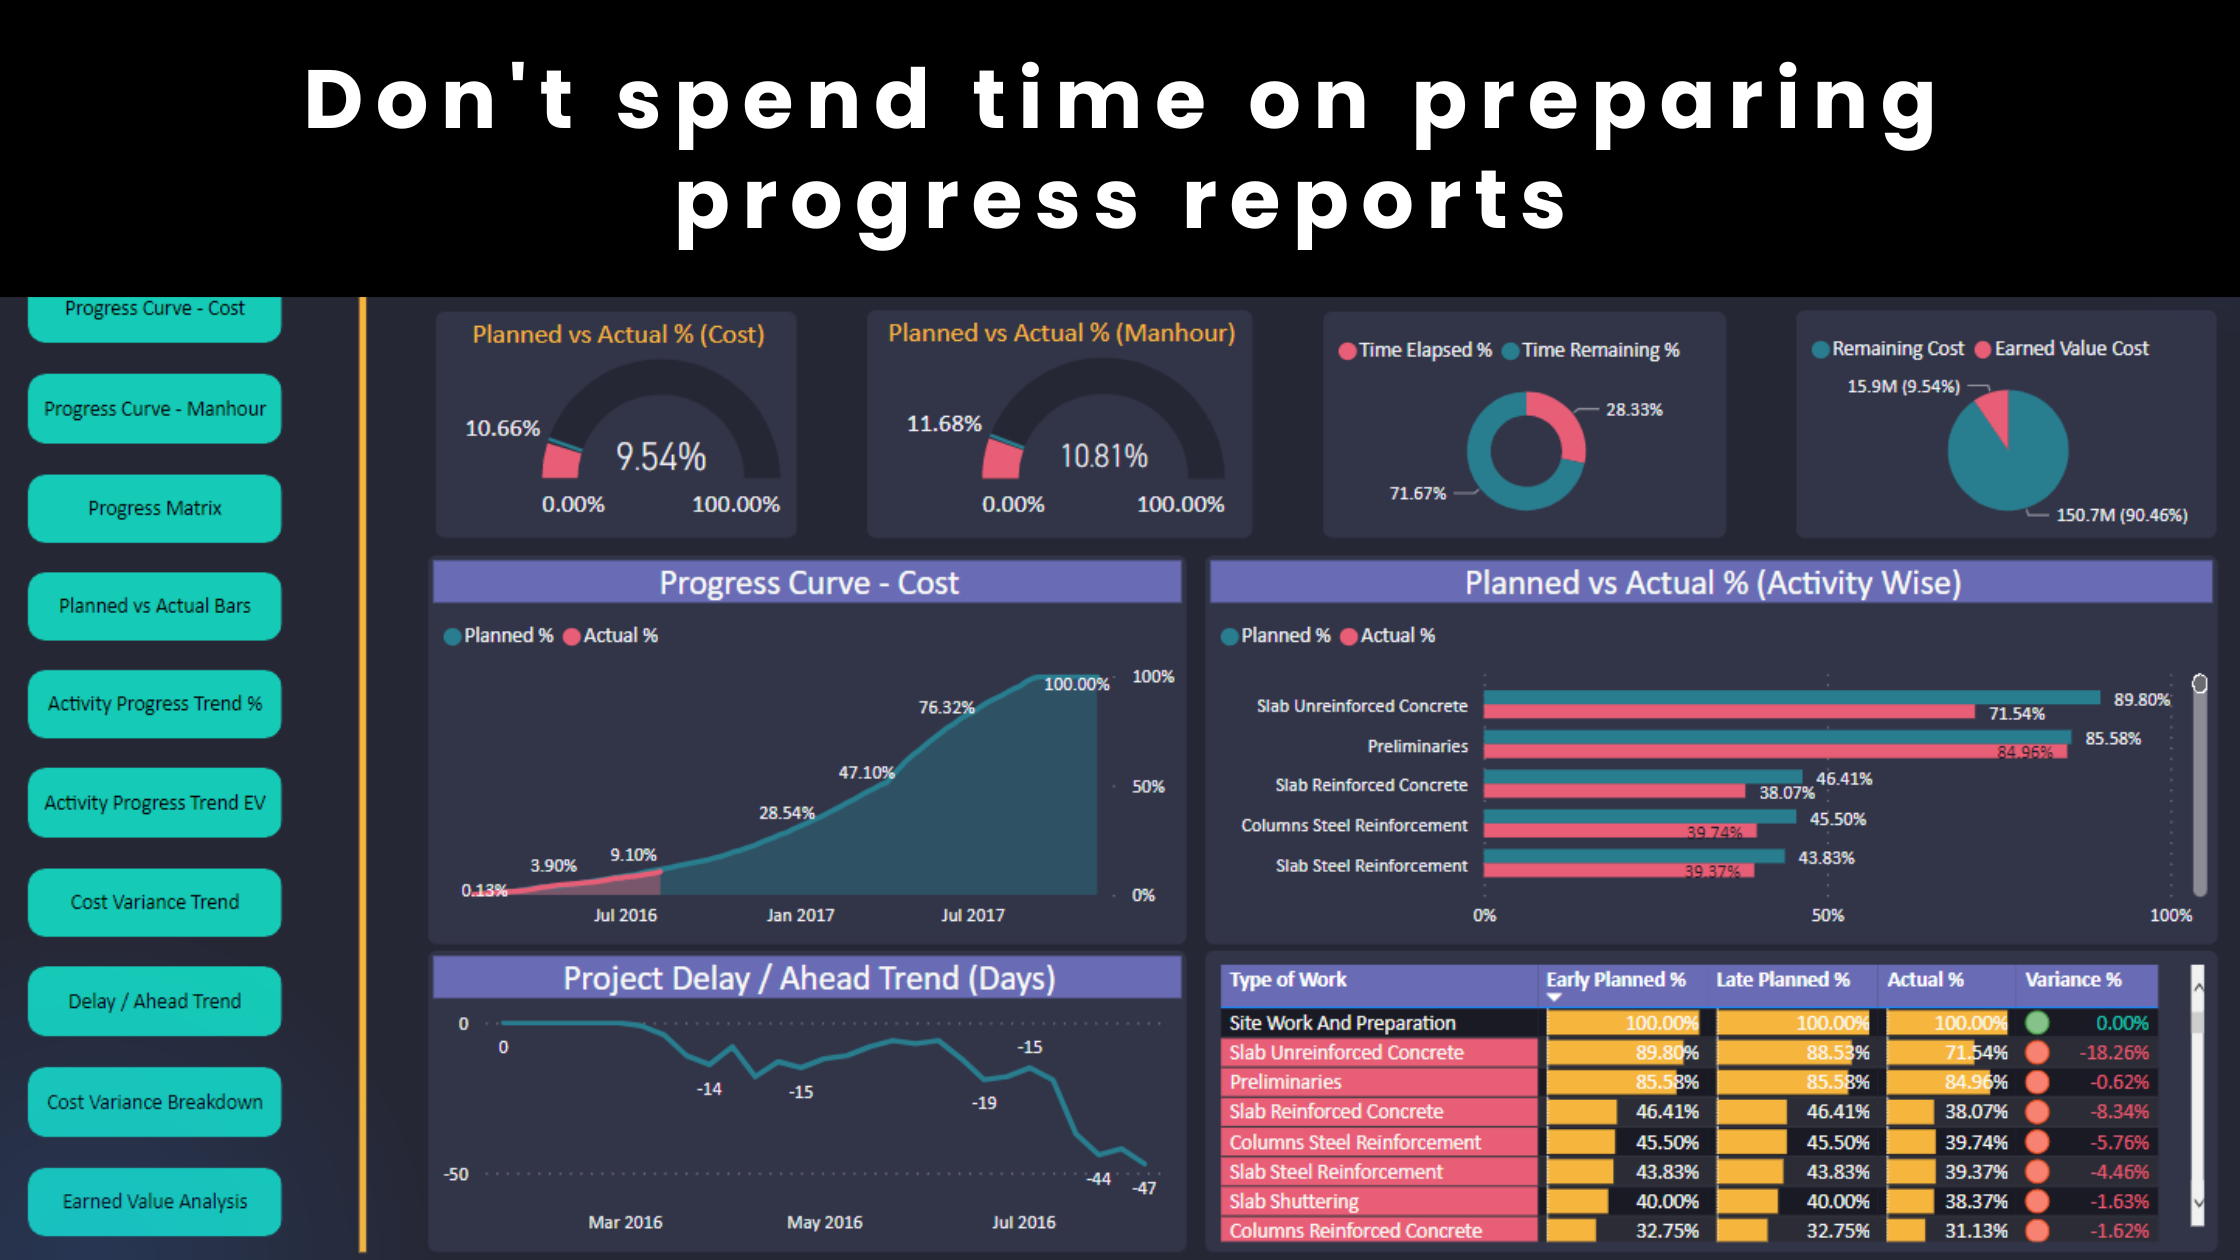
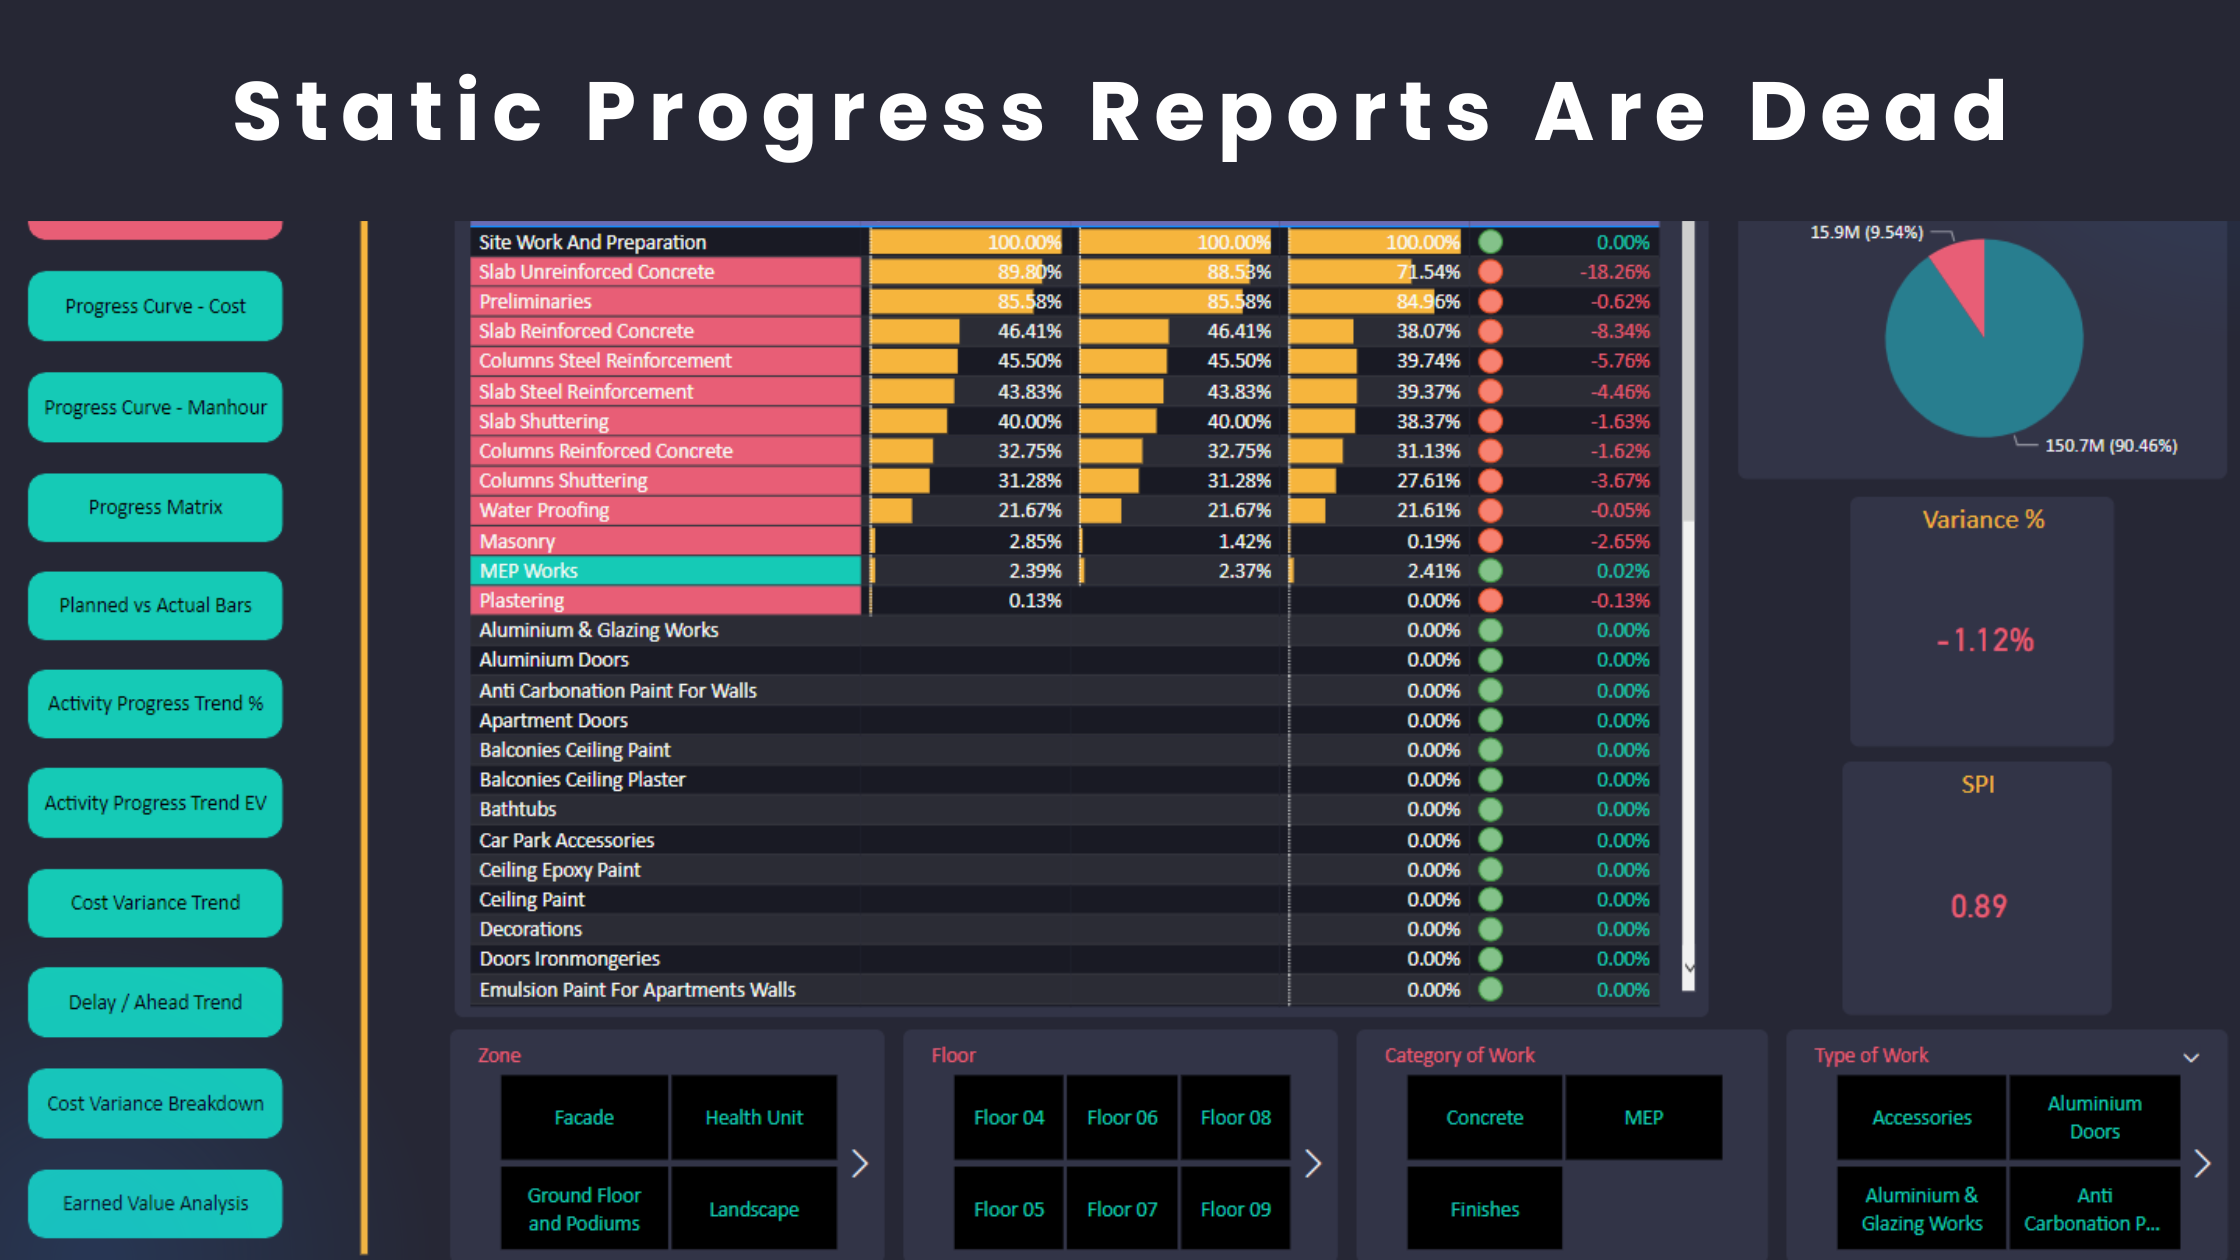
- Complete progress reports in seconds.
- Analyze any area in the project with a click of a button.
- Have all planning work in one layout, one location using one tool.
- Connect your drawings with the progress data and present photos.
- Not waste time importing several XER files or browsing reports to find the information that you need.
- Impress stakeholders and build a powerful brand in front of clients.
- Attach Power BI reports with your CV.
- Do all of the above using a free tool.


Regards,
Osama Saad, MBA, PMP, PSP, PMI-SP
Learn More!


